SimulationLab ladder
Level 7 of 10 · Climate science
VERIFIEDTransient climate response 1.60 [1.42, 1.80] K, inside the IPCC AR6 range. Recovers 10/10 synthetic truths; 93% of observations fall in the 90% band.

L07: Earth's Thermostat

Real data meets the model. We take a two-box climate model, fit it to 146 years of NASA temperature records with Markov chain Monte Carlo, and ask how much the past really tells us about the future. The model is small enough to run a million times. The past record, it turns out, pins down one number well (the transient response) and leaves the one people care about most (equilibrium sensitivity) mostly to the priors.
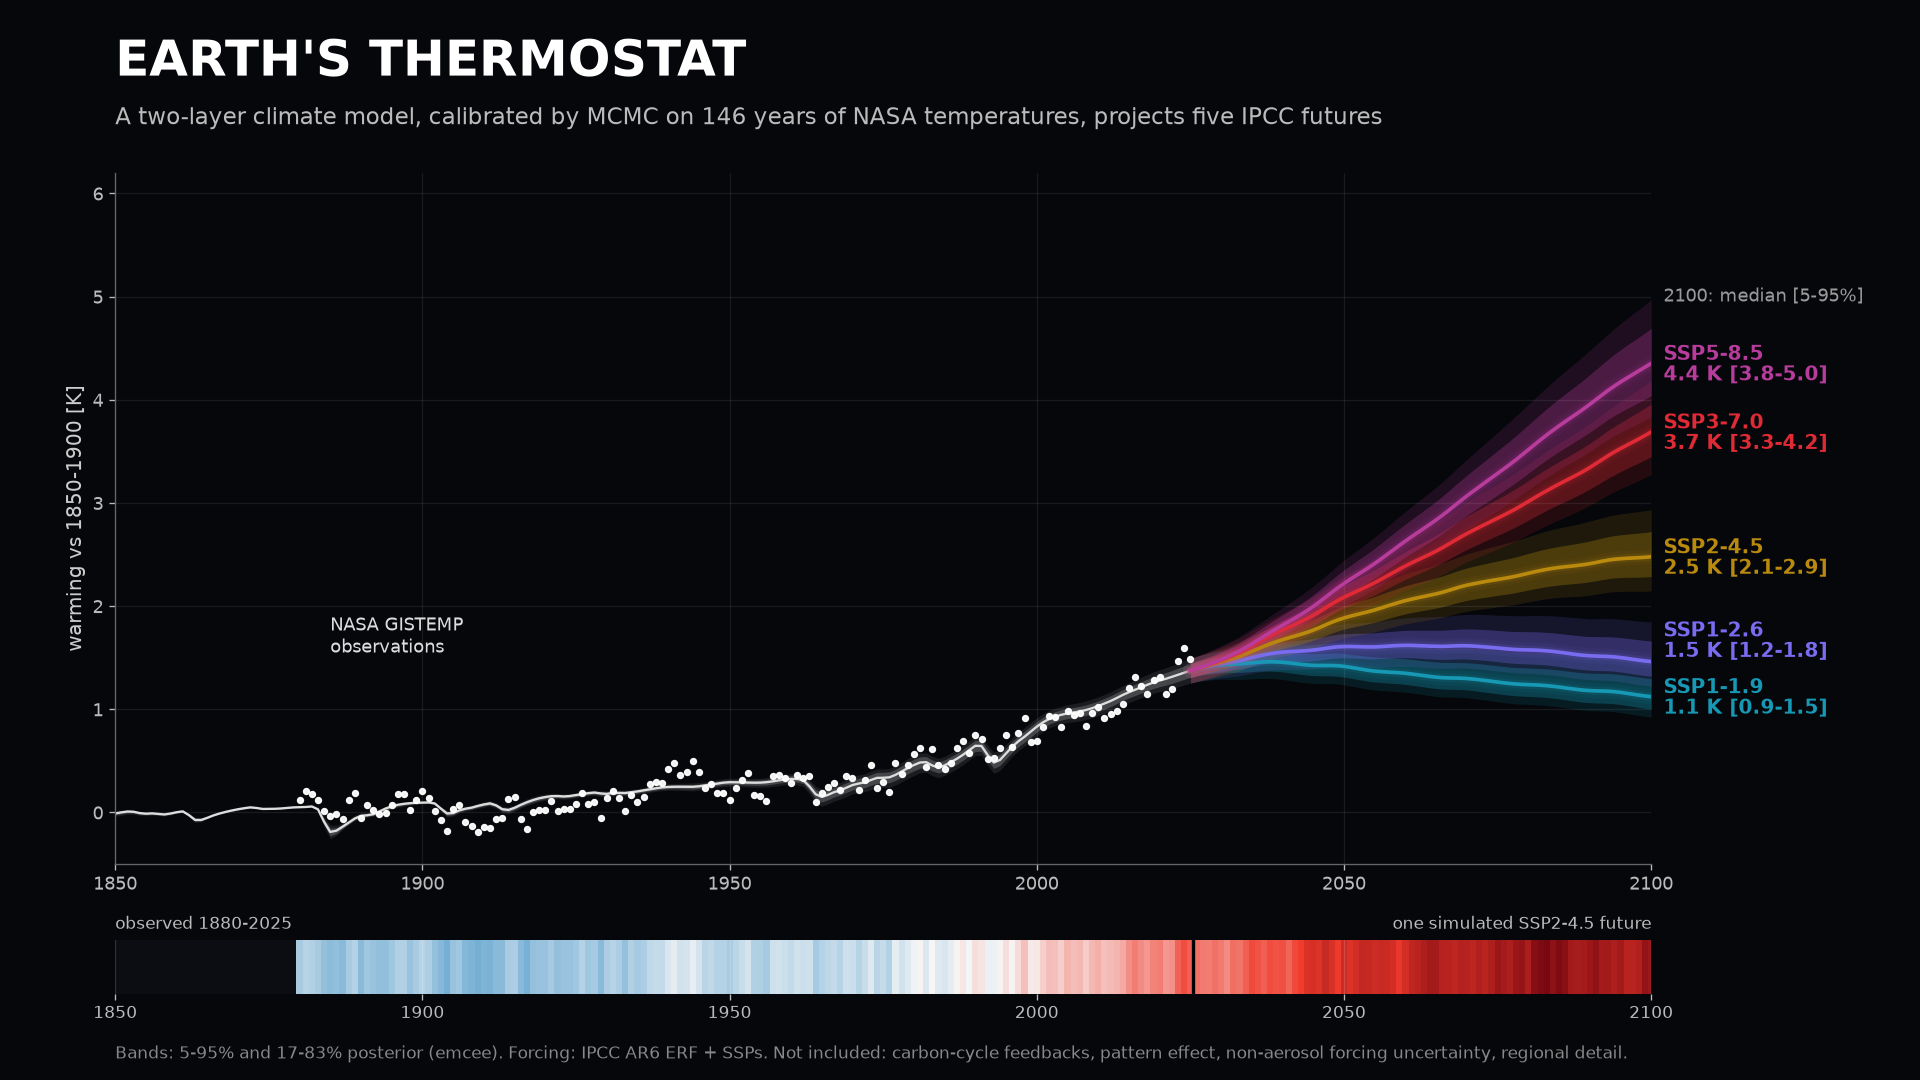
hero

Movie: output/mcmc_walkers.mp4 (1280×600, 8 s, H.264). 64 emcee walkers start from random prior draws and climb onto the posterior. Left: each walker's (ECS, aerosol scale), with the final posterior as white contours. Right: each walker's simulated climate against NASA GISTEMP.


1. The question

Doubling CO₂ adds about 3.9 W m⁻² of energy to the climate system. How much warmer does the planet get? Two numbers summarise the answer:

IPCC AR6 (2021) assessed ECS at 3 K (likely 2.5 to 4 K) and TCR at 1.8 K (likely 1.4 to 2.2 K), combining process understanding, paleoclimate, the historical record and models. This level uses only the historical record plus physically motivated priors, and turns the question into a calibration problem:

  1. Which parameter values of a simple energy-balance model are consistent with observed warming, given realistic, autocorrelated year-to-year noise?
  2. How do we know the sampler and the likelihood are working? (diagnostics, posterior predictive checks, synthetic-truth recovery, coverage)
  3. Which parameters actually drive the uncertainty, in the past and in 2100? (Sobol vs one-at-a-time)
  4. What does the calibrated model project for the five IPCC SSP scenarios, and what can such a model not say?

2. The model

Two-layer energy balance (Held et al. 2010; Geoffroy et al. 2013a). A mixed layer (atmosphere, land and upper ocean) with temperature $T$ sits on a deep ocean with temperature $T_d$:

$$C\,\frac{dT}{dt} = F(t) - \lambda T - \gamma\,(T - T_d), \qquad C_d\,\frac{dT_d}{dt} = \gamma\,(T - T_d)$$

$$F(t) = F_{\text{non-aer}}(t) + \alpha_{aer}\,F_{aer}(t)$$

Symbol Meaning Units
$\lambda$ climate feedback parameter (how fast extra heat radiates away) W m⁻² K⁻¹
$\gamma$ heat exchange between the layers W m⁻² K⁻¹
$C,\ C_d$ heat capacities of the mixed layer and deep ocean W yr m⁻² K⁻¹ (1 unit ≈ 7.7 m of seawater over the whole globe)
$\alpha_{aer}$ scale factor on the IPCC aerosol forcing (the most uncertain forcing) 1

Derived quantities: $\text{ECS} = F_{2\times}/\lambda$ with $F_{2\times}=3.93$ W m⁻² (AR6). TCR is the mean warming over years 61 to 80 of a 1 %/yr CO₂ ramp. The Earth's energy imbalance is $N = F - \lambda T$. The system has two e-folding modes: a fast one (years, the mixed layer) and a slow one (centuries, the deep ocean).

Exact integration. The model is linear, $\dot{\mathbf x} = A\mathbf x + B F$. With annual forcing held constant over each year, the one-year map $\mathbf x_{n+1} = e^{A}\mathbf x_n + A^{-1}(e^{A}-I)B\,F_n$ is exact. $e^A$ comes from Sylvester's formula for a 2×2 matrix with real eigenvalues, written out in closed form inside a Numba kernel. There is no time-step error, and one run of 1750 to 2100 costs a few microseconds per parameter set.

Statistical model. Observed anomaly = model + baseline offset + AR(1) noise:

$$y_t = T_t(\theta) + T_0 + r_t, \qquad r_t = \rho\, r_{t-1} + e_t,\quad e_t\sim\mathcal N(0,\sigma^2)$$

The exact AR(1) likelihood draws $r_1$ from the stationary law $\mathcal N(0,\sigma^2/(1-\rho^2))$ and whitens the rest: $e_t = r_t - \rho r_{t-1}$. AR(1) "red noise" is Hasselmann's (1976) picture of weather forcing a slow ocean. It lumps internal variability (ENSO and the rest), measurement error and model error into one process.

Priors (8 parameters):

Parameter Prior Why
$\lambda$ Uniform(0.2, 4) broad; implies an ECS prior of 1 to 20 K, heavy toward low ECS (∝ 1/ECS²)
$\gamma,\ C,\ C_d$ lognormal centred on 35 CMIP6 two-layer fits (AR6 Ch. 7 data), log-spread ×2 medians 0.60, 8.1, 99; physics from climate models, widened because an ensemble shares biases
$\alpha_{aer}$ Normal(1, 0.35), truncated to [0, 3] AR6 aerosol ERF 1750-2019 is −1.1 [−1.7, −0.4] W m⁻²
$T_0$ Uniform(−1, 1) K baseline offset between GISTEMP (1951-1980) and the model's 1750 zero
$\sigma$ Uniform(0.01, 0.3) K innovation noise
$\rho$ Uniform(0, 0.95) lag-1 autocorrelation

Data (downloaded with requests, cached in data/, parsed with pandas):

Source What Used for
NASA GISTEMP v4 GLB.Ts+dSST.csv global land+ocean annual anomaly, 1880-2025 the likelihood
IPCC AR6 WG1 Ch. 7 AR6_ERF_1750-2019.csv assessed effective radiative forcing by agent model input 1750-2019
NOAA Mauna Loa co2_annmean_mlo.csv annual CO₂, 1959-2025 checking AR6 CO₂ forcing against measurements, and extending it to 2020-2025
IPCC Ch. 7 SSPs/ERF_ssp*_1750-2500.csv forcing for SSP1-1.9, 1-2.6, 2-4.5, 3-7.0, 5-8.5 non-CO₂ forcing 2020-2025 (SSP2-4.5), and projections
IPCC Ch. 7 cmip6_twolayer_tuning_params.csv two-layer fits to 35 CMIP6 models priors on $\gamma, C, C_d$, and the CMIP6 ECS spread

Assumptions. Global means only. Constant feedback $\lambda$ (no pattern effect, no deep-ocean efficacy). Forcing is prescribed (no carbon cycle). Forcing uncertainty enters only through $\alpha_{aer}$. The model starts in equilibrium in 1750.

3. M&S concepts you'll learn here

4. Tech stack

Tool Role here
Python 3.12, NumPy everything numeric; vectorised likelihood across walkers
Matplotlib (+ ffmpeg via imageio-ffmpeg) all figures (handmade corner plot, trace plots, fan charts) and the MP4
SciPy linalg.expm as the independent check of the integrator; ndimage.gaussian_filter to smooth corner-plot contours
Numba the model kernel: @njit(parallel=True), one prange lane per parameter set, 3 threads
★ pandas parsing four CSV formats (GISTEMP's *** gaps, NOAA's # comments, IPCC's per-agent tables), splicing forcing series by year index, the posterior summary CSV
★ requests live downloads from NASA, NOAA and GitHub with timeouts and raise_for_status, cached to data/ so reruns work offline
★ emcee affine-invariant ensemble MCMC with vectorize=True (one Numba call per half-ensemble) and DEMove + DESnookerMove; get_autocorr_time, emcee.autocorr.integrated_time
★ SALib Saltelli/Sobol sampling (SALib.sample.sobol) and variance-based indices with bootstrap CIs (SALib.analyze.sobol); the bundled Ishigami function for verification

SimPy, Mesa and NetworkX from earlier levels are still in the environment but are not needed here. pandas and requests turn "a model" into "a model that eats live data". emcee and SALib turn "a run" into "a distribution of runs you can reason about".

5. Industry & scientific tools

Tool What it is Who uses it How this project maps to it
FaIR (Finite-amplitude Impulse Response) open-source Python emulator: emissions → concentrations → forcing → a 3-layer EBM IPCC AR6 WG1 and WG3 (scenario warming classification), many research groups our ebm is FaIR's temperature module with 2 boxes instead of 3. FaIR v2 adds the carbon cycle and calibrates with a constrained ensemble, which is the same Bayesian idea
MAGICC reduced-complexity climate model, probabilistic set-up IPCC WG3, IAM teams (IIASA, PIK), NGFS finance scenarios same role: emulate ESMs cheaply and propagate parameter uncertainty to SSP projections
CMIP6 ESMs (CESM2, E3SM, UKESM, …) 3-D coupled Earth system models on supercomputers national labs, the CMIP6 archive behind every IPCC figure our priors come from two-layer fits to these models; the white ticks in the ECS figure are 35 of them
PyMC / Stan probabilistic programming with gradient-based HMC/NUTS statistics, epidemiology, pharma, finance the same posterior written as a model block; NUTS needs gradients (JAX/Stan autodiff through the time loop) but mixes far better in high dimensions
ArviZ diagnostics and plots for Bayesian inference PyMC/Stan/emcee users R-hat, ESS, trace, pair and PPC plots; we hand-roll the emcee-native equivalents (τ, N/50τ, corner, PPC)
Dakota (Sandia) optimisation, UQ and sensitivity toolkit that wraps any simulation code DOE labs, aerospace, nuclear sampling, sobol and Bayesian calibration (QUESO/DREAM) methods do what our SALib + emcee pipeline does, for expensive black-box models
UQLab (ETH Zürich) MATLAB UQ framework: surrogates, Sobol, Bayesian inversion engineering UQ Sobol via polynomial chaos surrogates: the move when each model run costs hours, not microseconds
OpenTURNS open-source C++/Python UQ library (EDF, Airbus, Phimeca) energy and aerospace industry probabilistic input models, Sobol/Shapley indices, calibration; supports dependent inputs, which our Sobol box ignores

6. Results

All numbers below are printed by sim.py (seed 2021, deterministic).

The data, and a real-data sanity check on the forcing
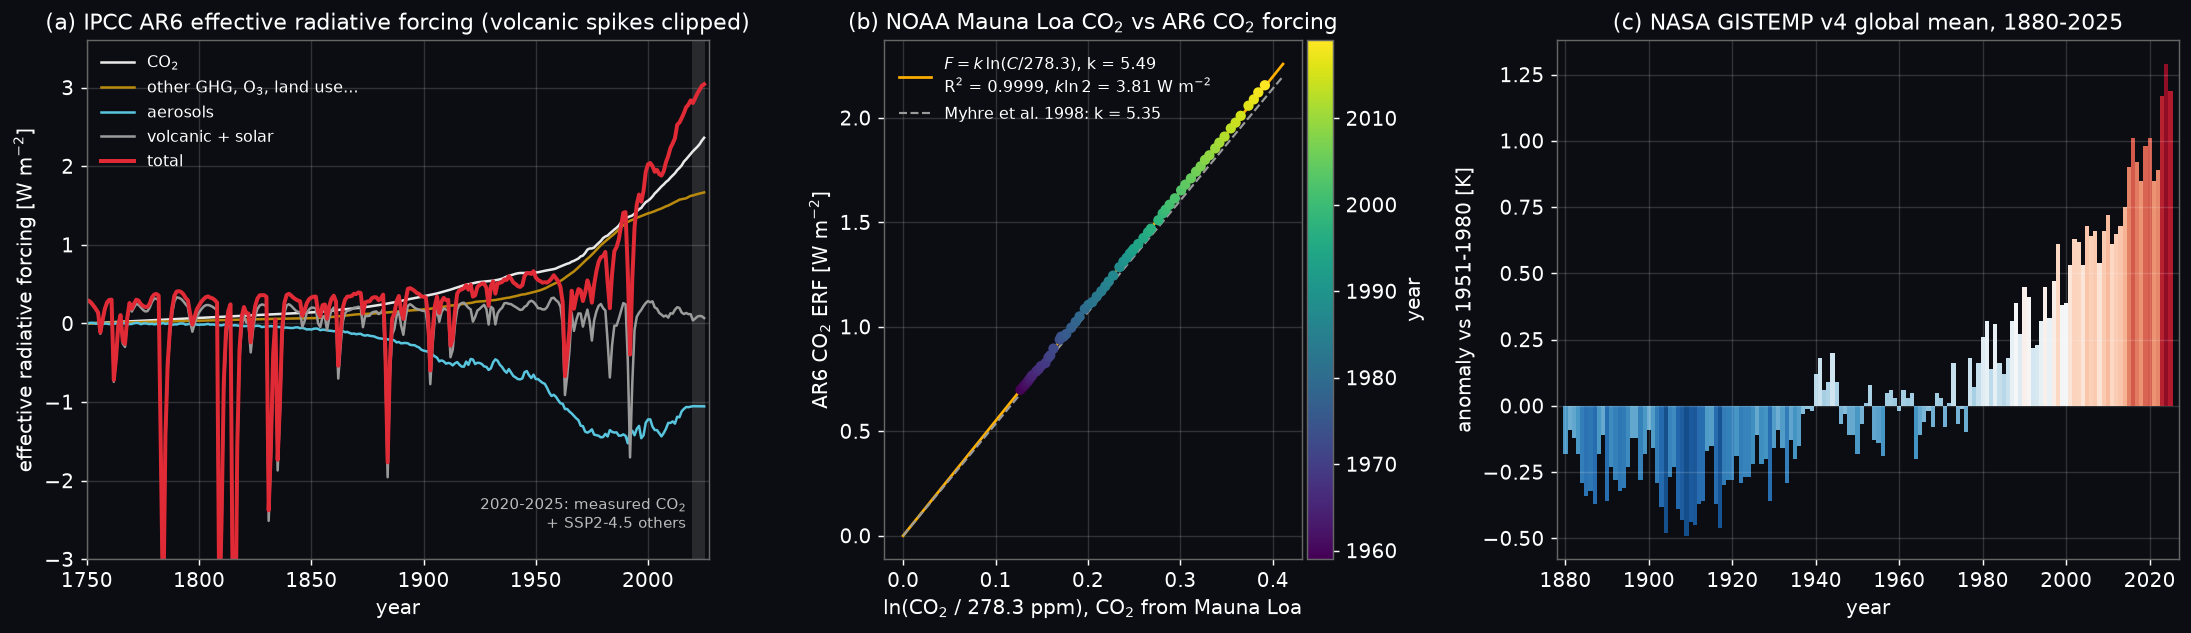
data

MCMC: 64 walkers × 30 000 steps in 23 s
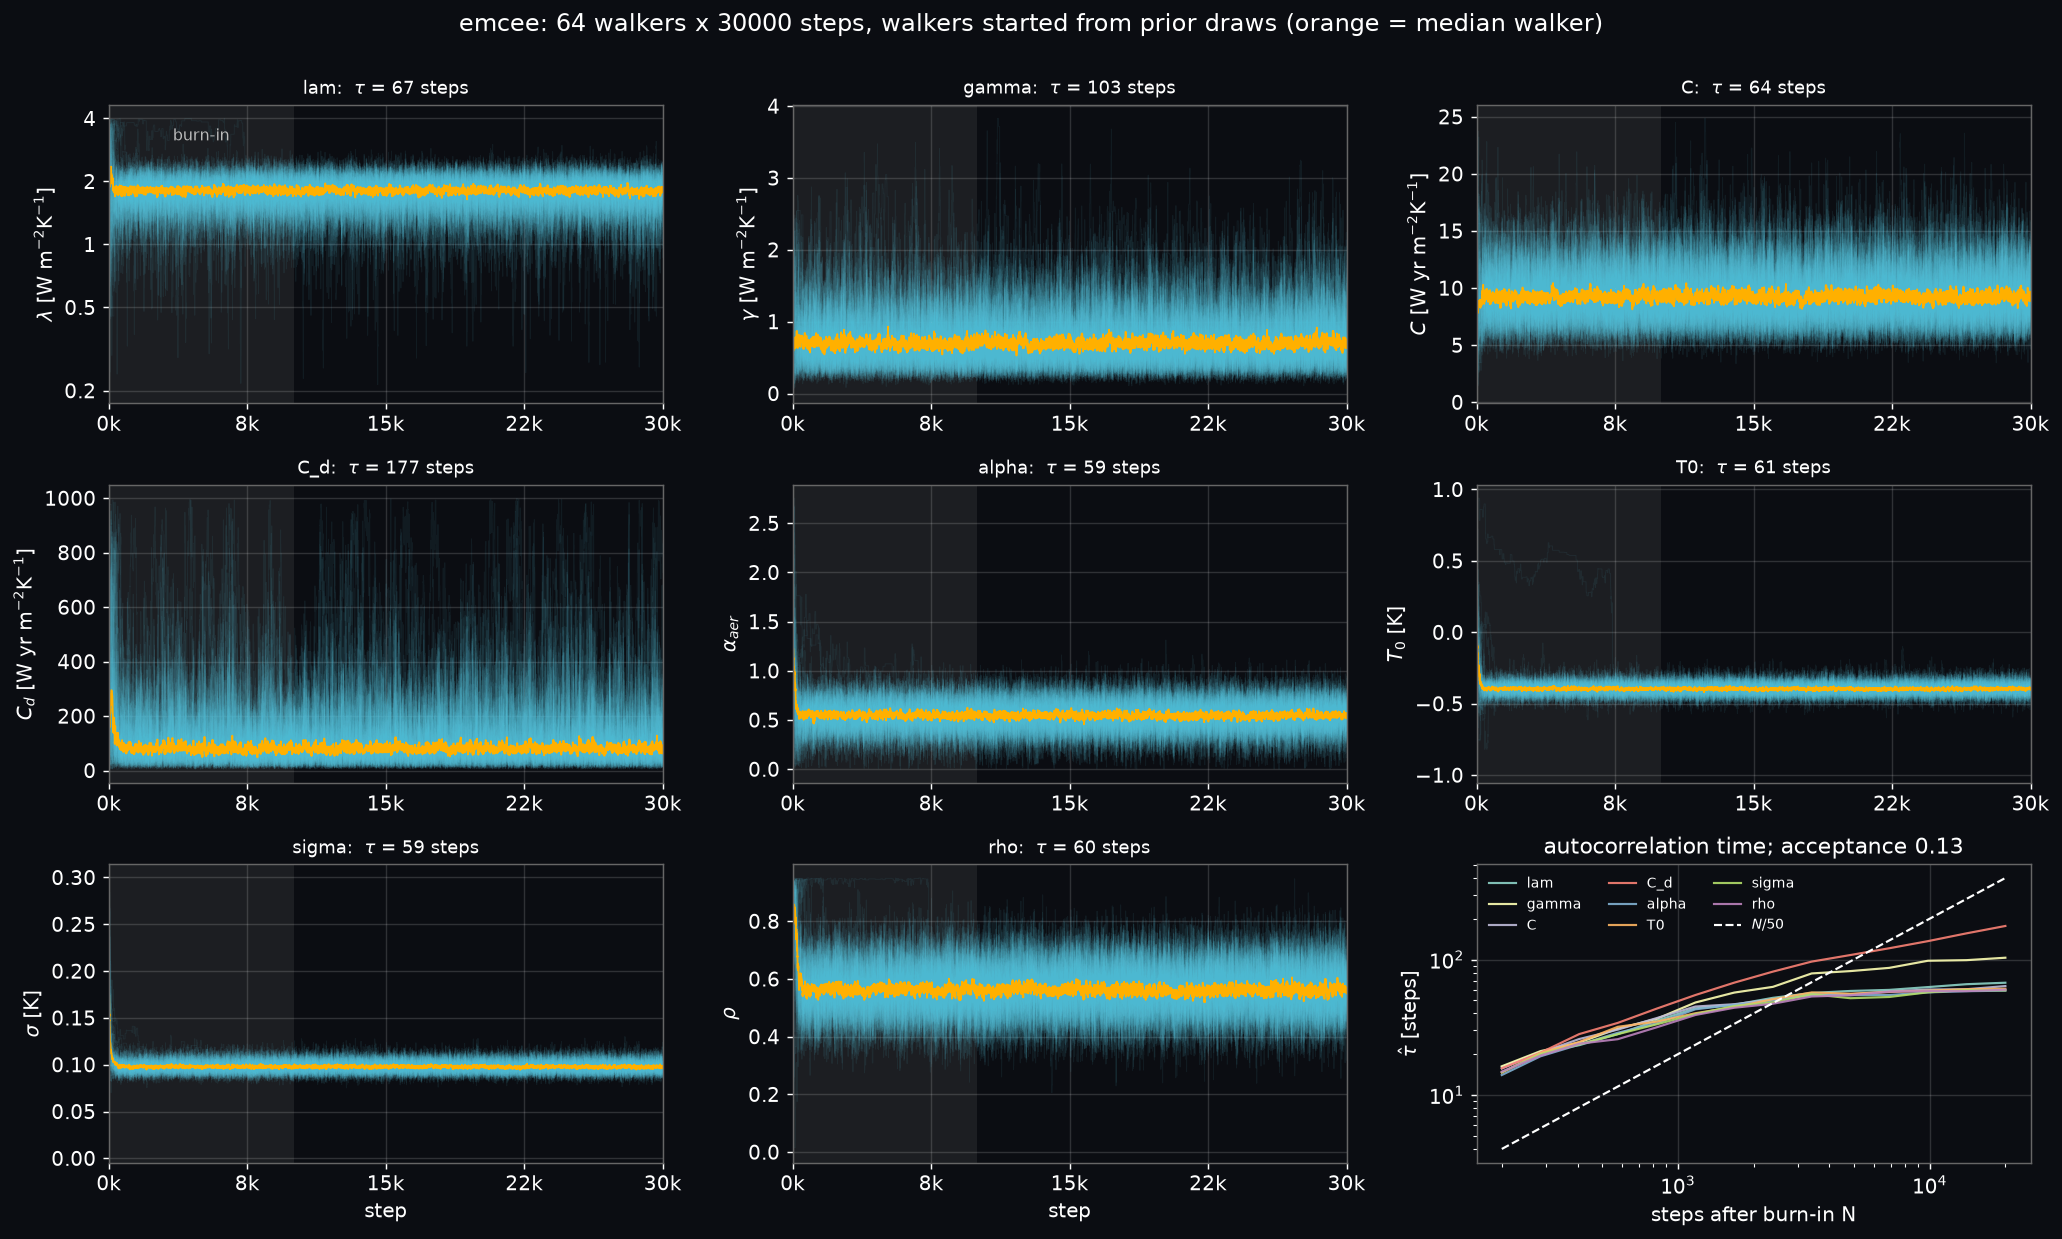
mcmc

Posterior (median [5 %, 95 %]; the full table is in output/posterior_summary.csv):

λ [W m⁻²K⁻¹] γ C [W yr m⁻²K⁻¹] C_d α_aer T0 [K] σ [K] ρ
1.81 [1.29, 2.22] 0.70 [0.33, 1.48] 9.3 [6.4, 13.5] 82 [21, 338] 0.54 [0.31, 0.77] −0.40 [−0.46, −0.33] 0.098 [0.089, 0.109] 0.56 [0.44, 0.69]

Derived: ECS 2.17 [1.77, 3.04] K, TCR 1.60 [1.42, 1.80] K. The fast mode is 3.6 [2.2, 5.7] yr and the slow mode 169 [38, 822] yr (Geoffroy et al. 2013a found ~4 and ~200+ yr across CMIP5). The implied aerosol forcing in 2019 is −0.58 [−0.82, −0.33] W m⁻², about half of AR6's central −1.1 W m⁻² and in the weak end of its [−1.7, −0.4] range. Simple models fitted to global temperature alone often prefer weak aerosols. With an aerosol-forcing prior this uninformative, the record would rather have a modestly sensitive climate with little masking.
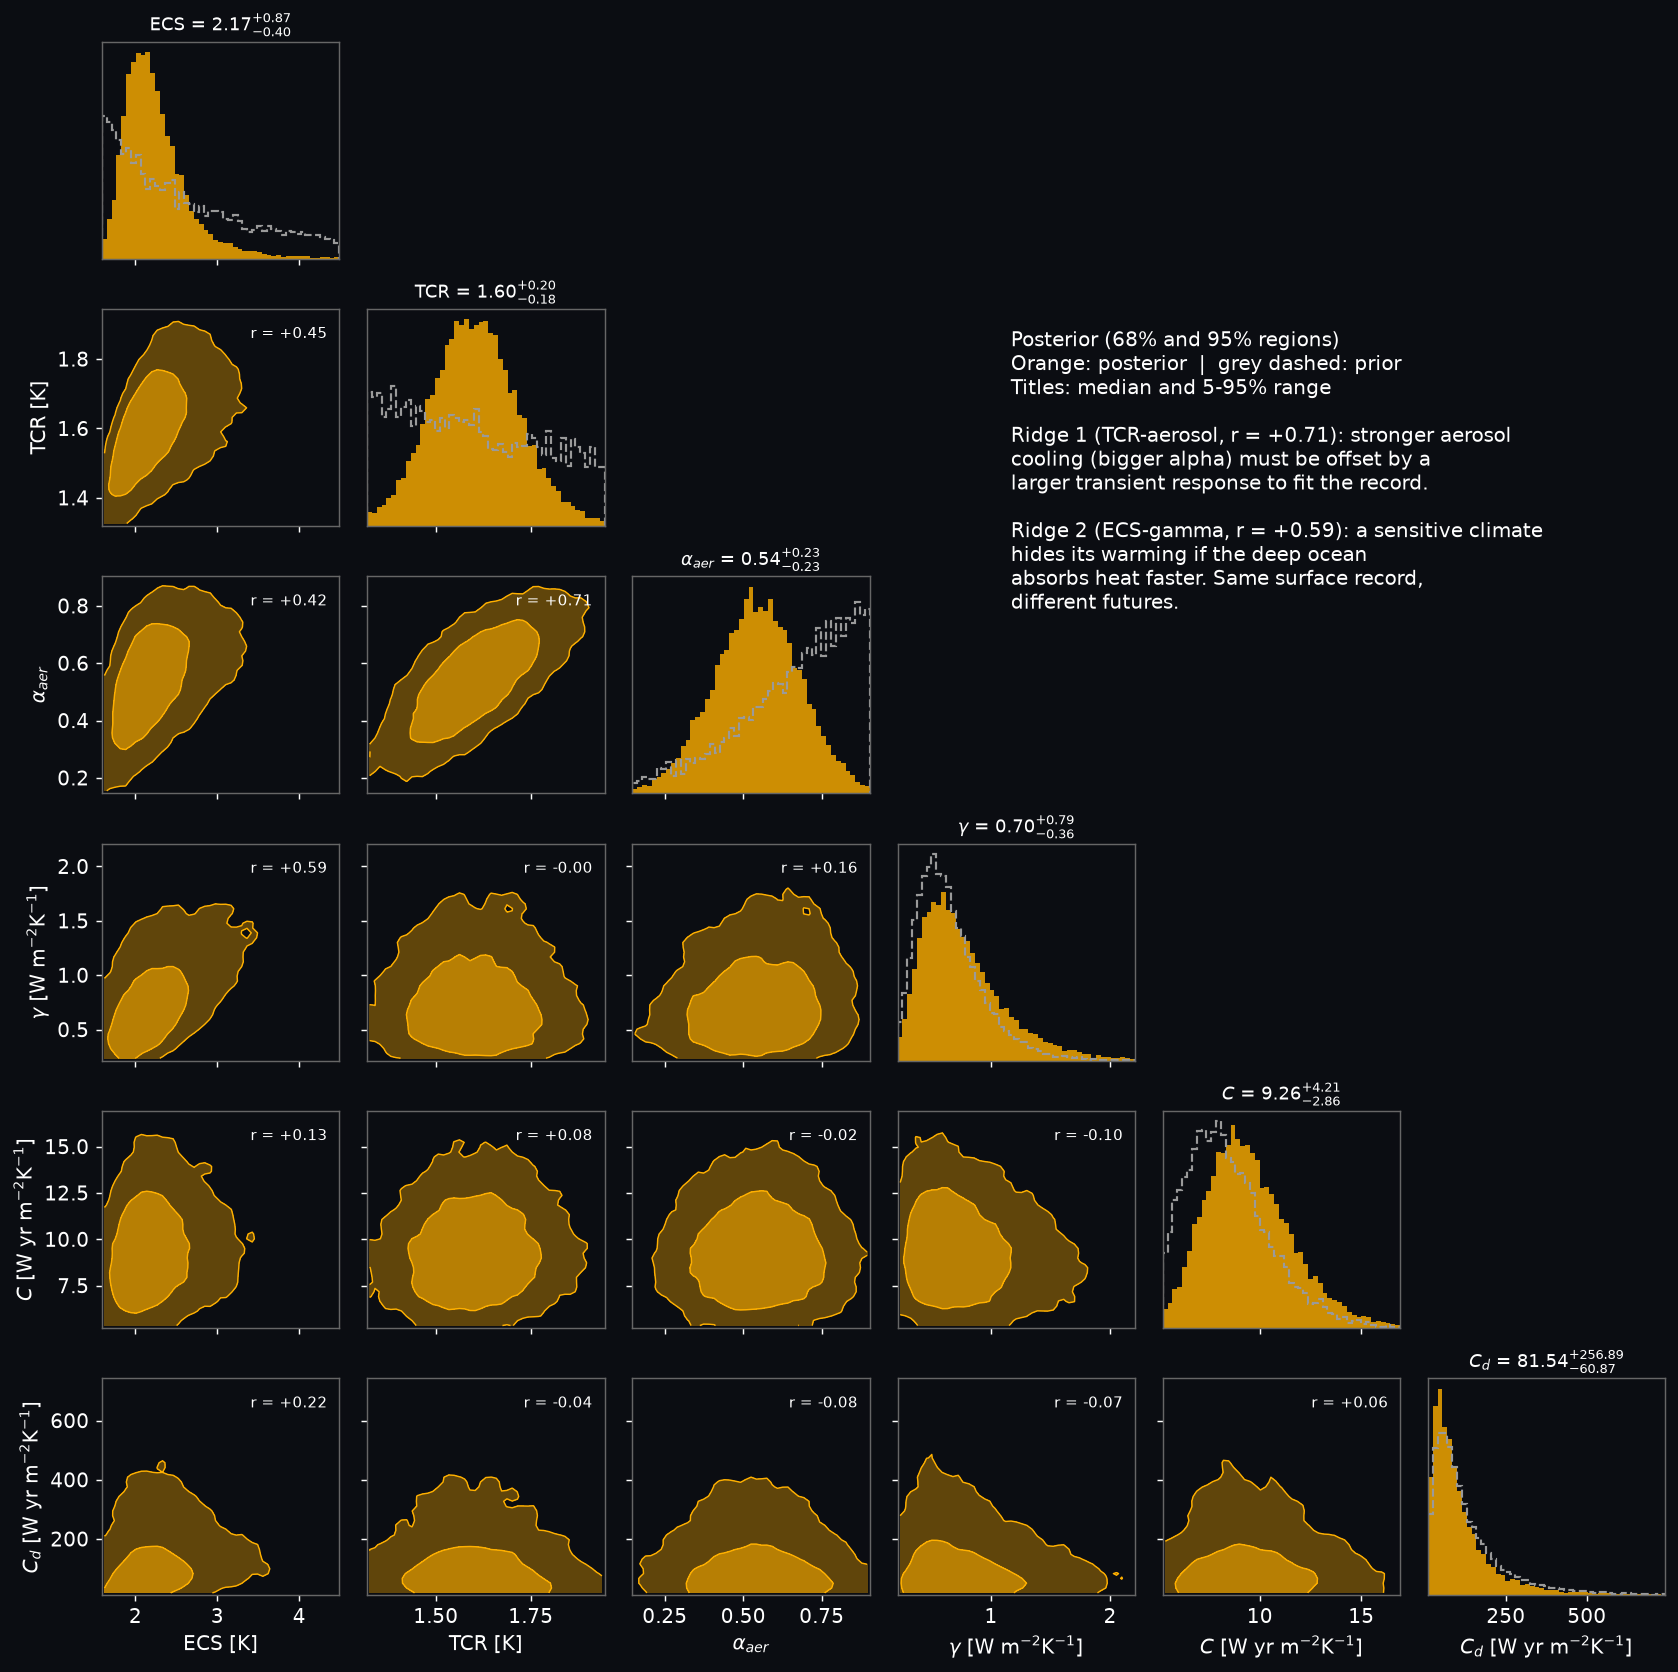
corner

The corner plot (hand-made in matplotlib: 2-D histograms, Gaussian smoothing, 68/95% highest-density contours) shows the two ridges that make climate calibration hard:

  1. TCR vs aerosols (r = +0.64). More aerosol cooling in the past needs a more responsive climate to produce the same warming.
  2. ECS vs γ (r = +0.58). A high-sensitivity climate can hide its warming if the deep ocean takes up heat faster. The surface record cannot tell these apart, but 2100 can.

$C_d$ is essentially its prior (compare the dashed line). 146 years of surface temperature say almost nothing about the deep ocean.

Does the noise model matter? AR(1) vs white noise

The same MCMC with ρ fixed at 0 (independent residuals):

Quantity AR(1) likelihood White-noise likelihood 90% width, white / AR(1)
TCR [K] 1.60 [1.42, 1.80] 1.58 [1.47, 1.69] 0.58
α_aer 0.54 [0.31, 0.77] 0.50 [0.36, 0.66] 0.65
T0 [K] −0.40 [−0.46, −0.33] −0.41 [−0.44, −0.37] 0.58
ECS [K] 2.17 [1.77, 3.04] 2.21 [1.86, 3.23] 1.08
C 9.3 [6.4, 13.5] 11.3 [7.9, 16.0] 1.13

With autocorrelated residuals, 146 years hold only about 146·(1−ρ)/(1+ρ) ≈ 41 independent pieces of information. The white-noise fit believes it has 146, so the quantities the data really constrain (TCR, aerosol scale, baseline) come out 35 to 42% too narrow. Quantities whose uncertainty comes from the prior and the degeneracies (ECS, C) do not shrink; they shift. Overconfidence hits exactly the numbers you would be tempted to quote.

Posterior predictive checks and an out-of-sample test
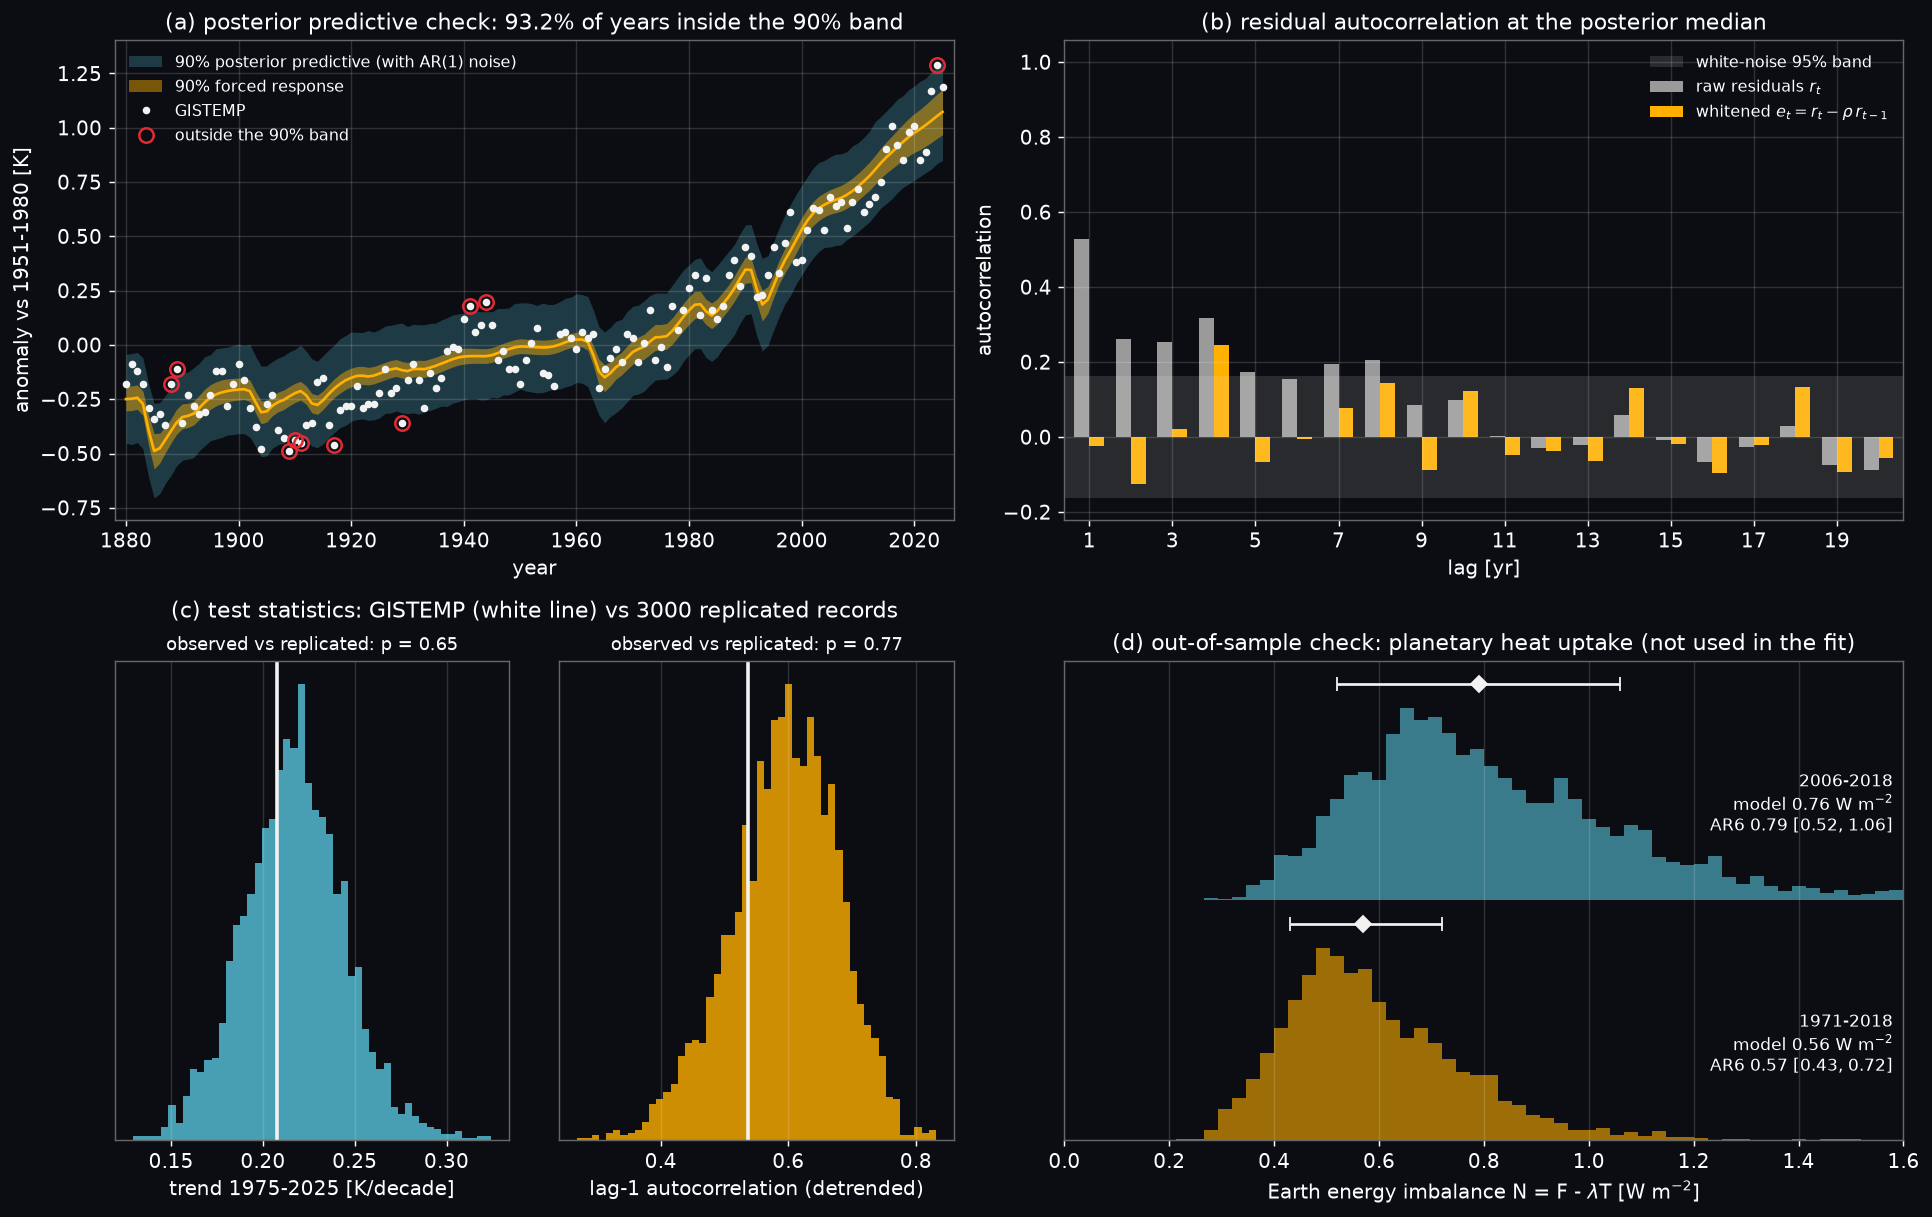
ppc

Period Posterior $N=F-\lambda T$ [W m⁻²] AR6 assessed (Table 7.1)
1971-2018 0.56 [0.36, 0.90] 0.57 [0.43, 0.72]
2006-2018 0.76 [0.47, 1.28] 0.79 [0.52, 1.06]

The medians agree to within 0.03 W m⁻², which is independent evidence that the calibrated heat uptake is physical. The posterior is wider than AR6's observational range, so adding ocean heat content to the likelihood would sharpen $\gamma$ and $C_d$ (Go further #2).

Synthetic truth: can the pipeline recover a known Earth?
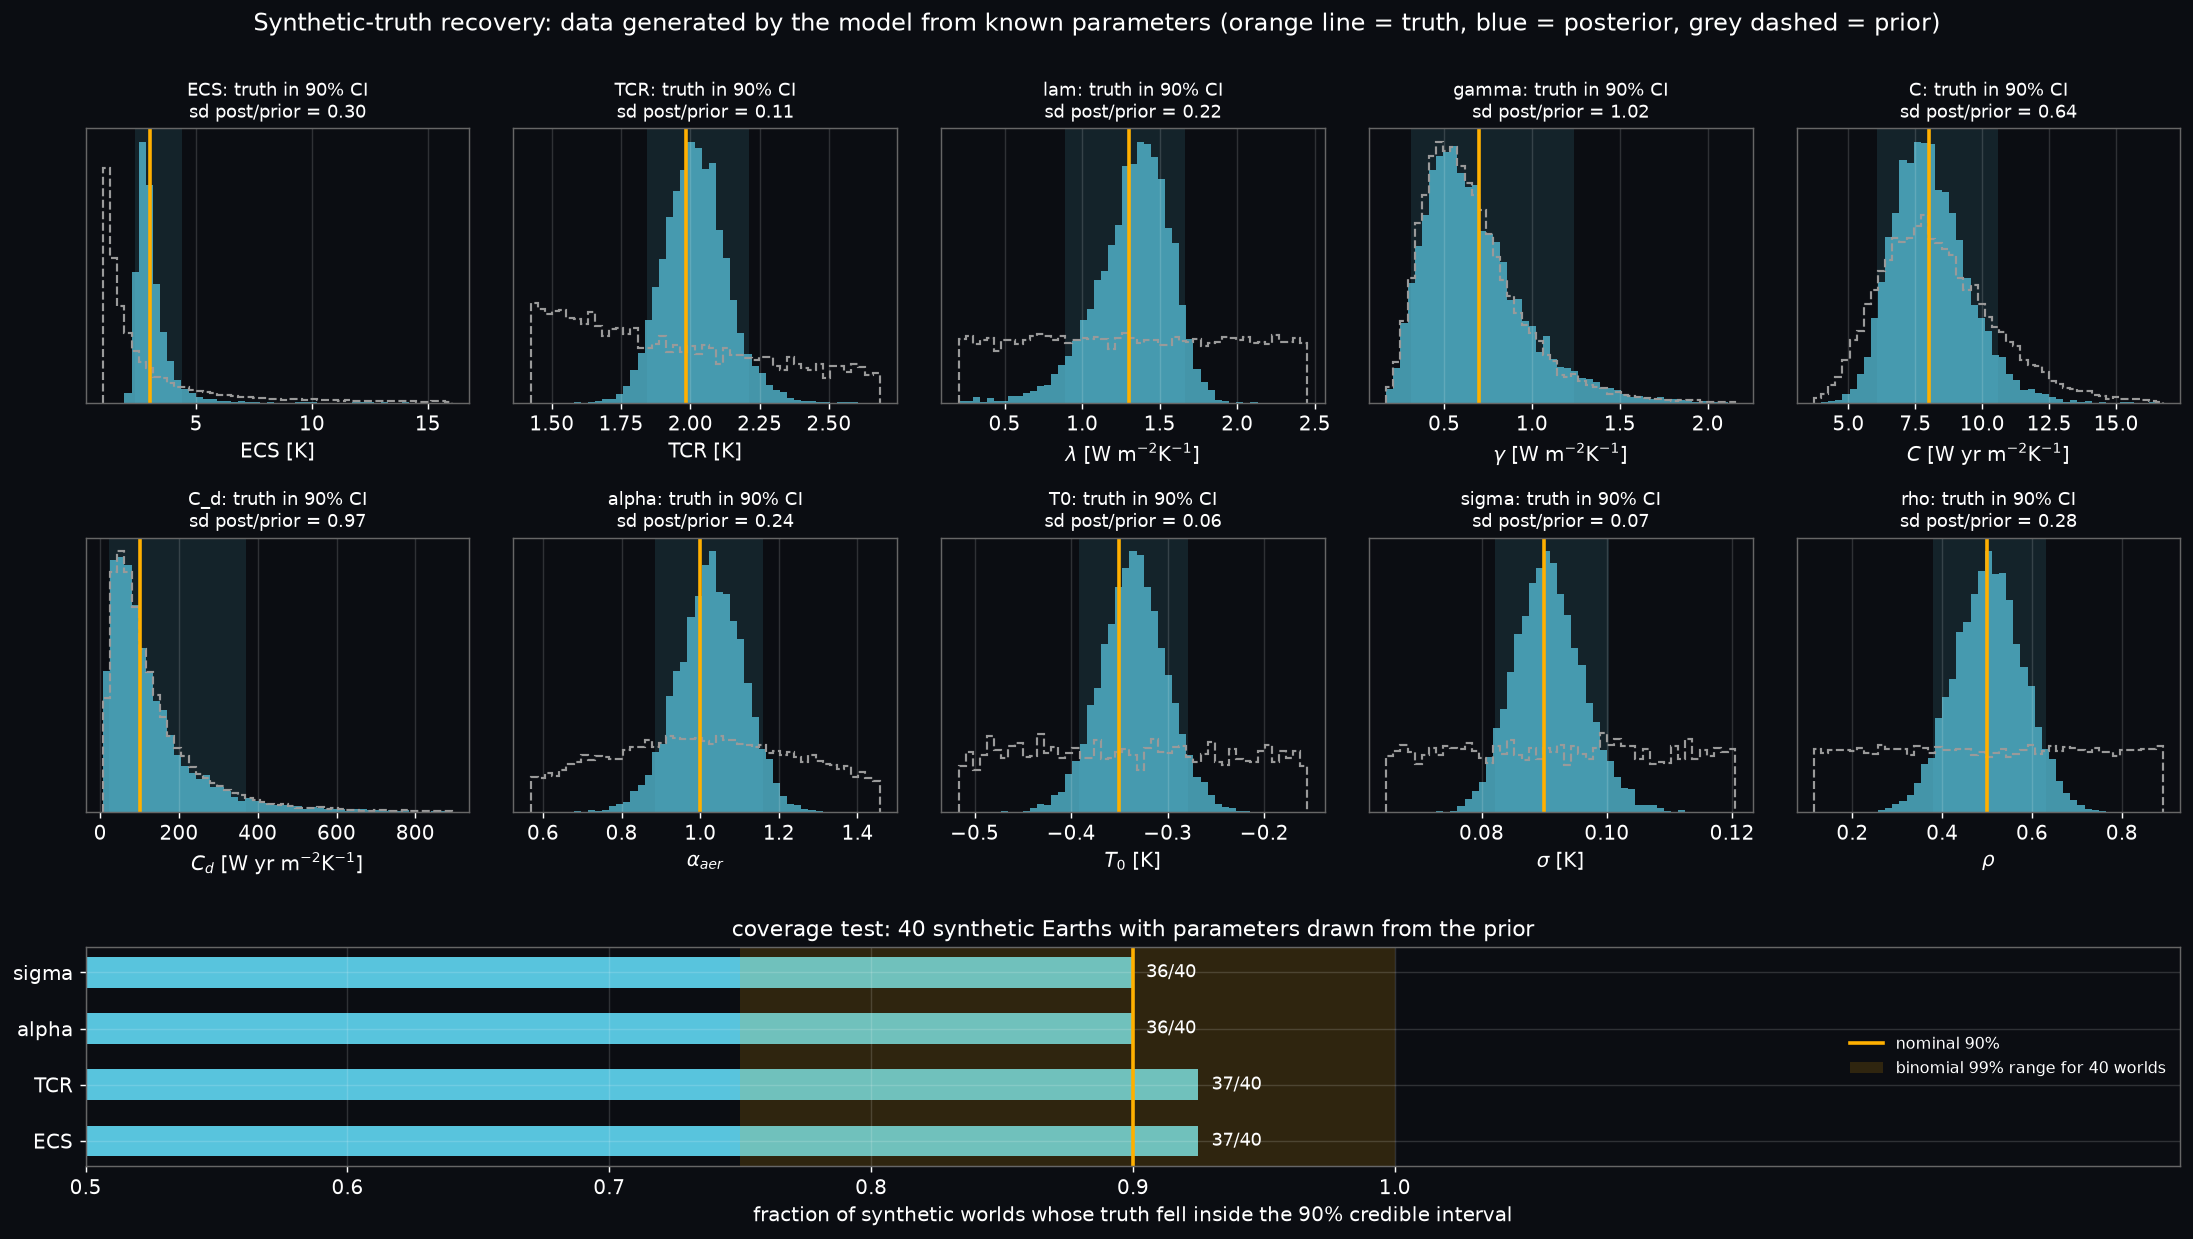
synthetic

We generate a fake record from the model with known parameters (λ = 1.3 so ECS = 3.02 K, γ = 0.7, C = 8, C_d = 100, α = 1, T0 = −0.35, σ = 0.09, ρ = 0.5), using the same years, forcing and AR(1) noise, then run the identical MCMC.

ECS TCR λ γ C C_d α T0 σ ρ
truth 3.02 1.98 1.30 0.70 8.0 100 1.00 −0.35 0.090 0.50
posterior median 2.90 2.02 1.36 0.62 7.9 94 1.03 −0.34 0.091 0.51
inside 90% CI ✓ ✓ ✓ ✓ ✓ ✓ ✓ ✓ ✓ ✓
sd(post)/sd(prior) 0.30 0.11 0.22 1.02 0.64 0.97 0.24 0.06 0.07 0.28

All 10 truths lie inside their 90% intervals. The last row is the real lesson. TCR is learned well (the posterior is 9× narrower than the prior), ECS moderately (3×), and γ and C_d are not learned at all (ratio ≈ 1): they are "recovered" only because the posterior is the prior. Even when the model is exactly right, the surface record cannot identify deep-ocean heat uptake.

Coverage test (bottom panel). A single recovery can succeed by luck. So we draw 40 truths from the prior, simulate 40 synthetic Earths and run 40 MCMCs (32 walkers × 5 000 steps each). The 90% intervals contain the truth in 37/40 (ECS), 37/40 (TCR), 36/40 (α), 36/40 (σ) of them, against an expected 36 ± 1.9 (binomial 99% range ≥ 30). The inference is calibrated. This is a small-scale version of simulation-based calibration (Talts et al. 2018).

ECS and TCR vs IPCC AR6
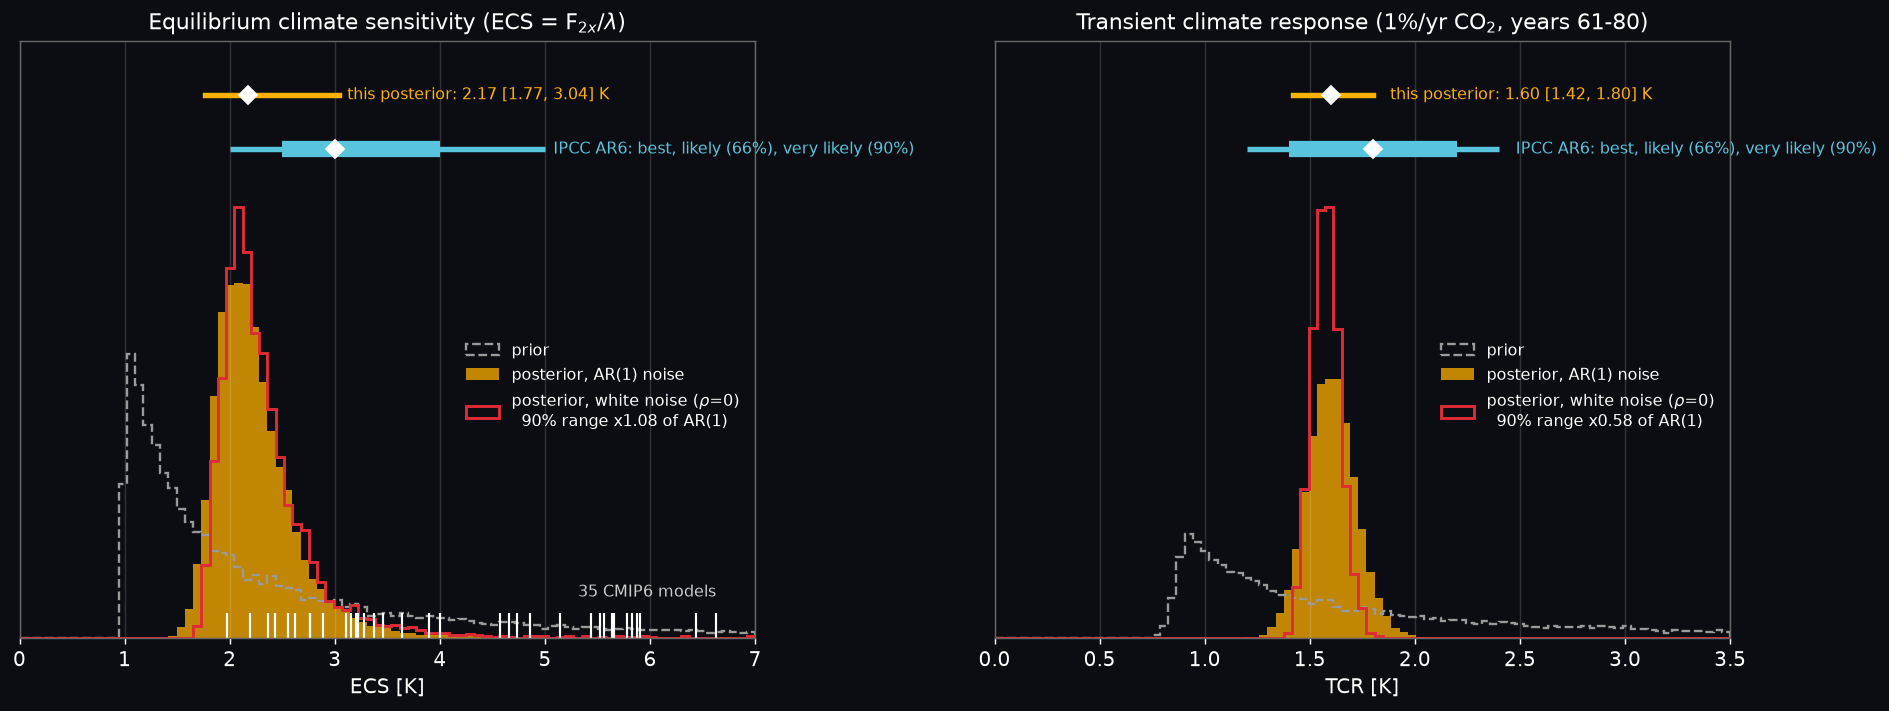
ecs tcr

This posterior: median, 66%, 90% IPCC AR6: best, likely (66%), very likely (90%)
ECS 2.17 K, [1.91, 2.56], [1.77, 3.04] 3.0 K, [2.5, 4.0], [2.0, 5.0]
TCR 1.60 K, [1.50, 1.71], [1.42, 1.80] 1.8 K, [1.4, 2.2], [1.2, 2.4]

Global sensitivity: Sobol vs one-at-a-time
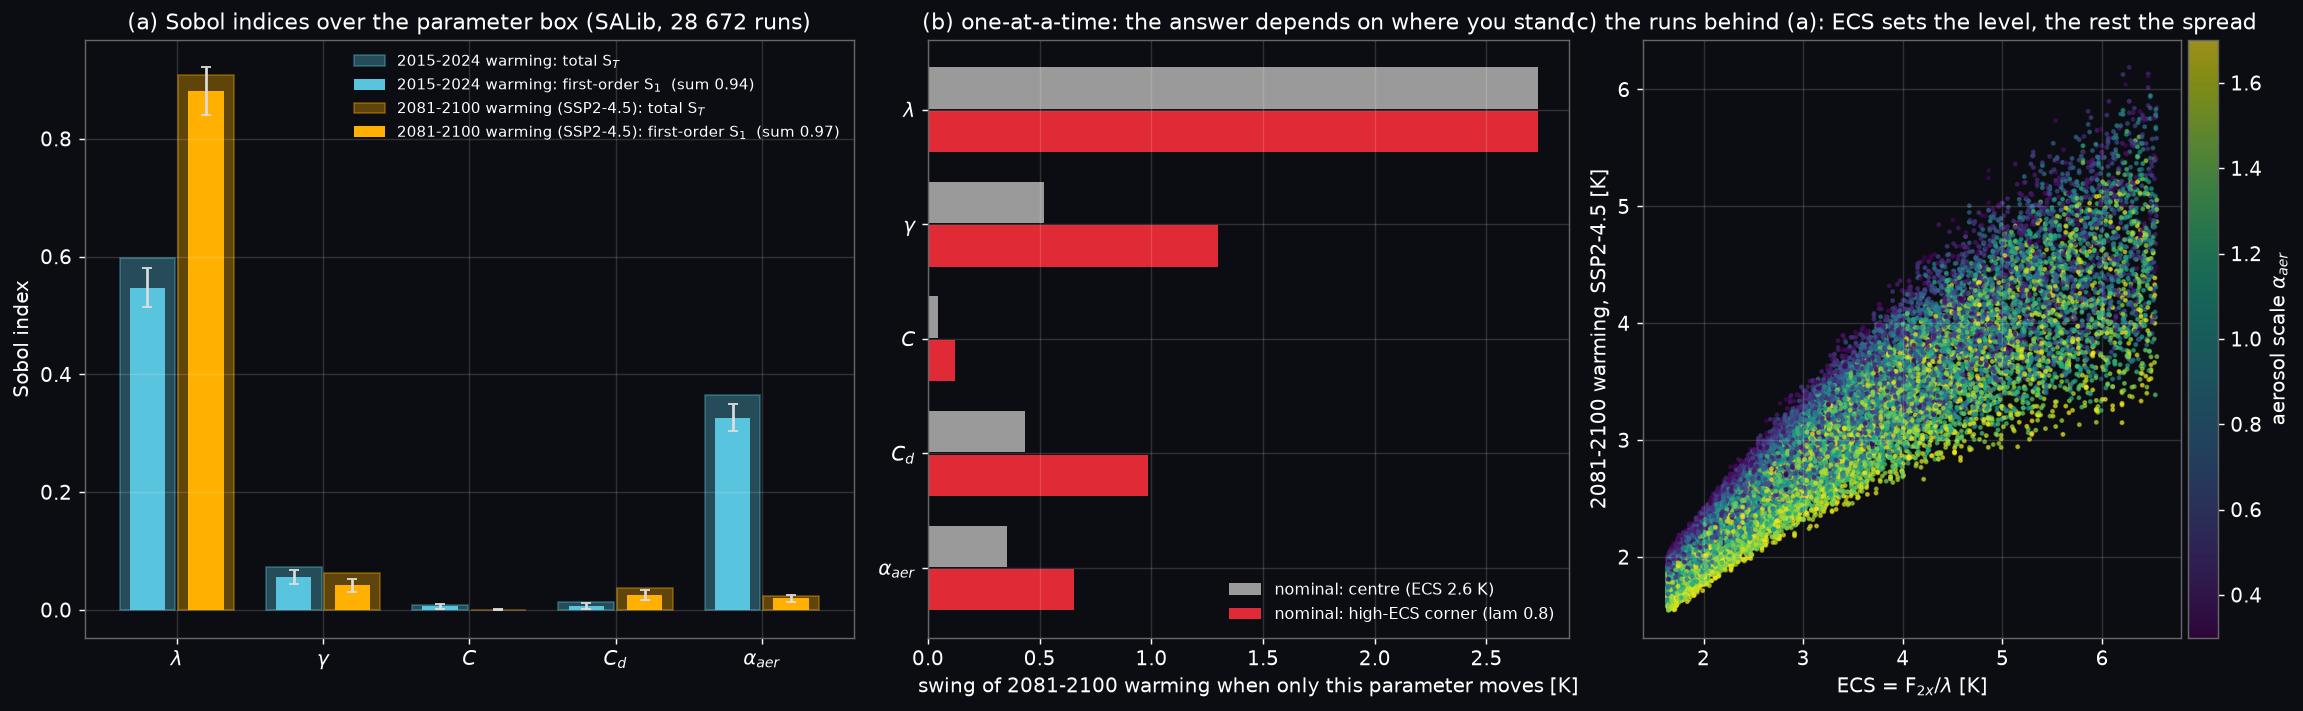
sobol

Inputs are λ ∈ [0.6, 2.4] (ECS 1.6 to 6.6 K), γ ∈ [0.3, 1.2], C ∈ [5, 12], C_d ∈ [40, 200] and α ∈ [0.3, 1.7], treated as independent uniforms. SALib Saltelli sampling uses N = 4096, giving 4096 × (5+2) = 28 672 model runs (about a second with Numba, including the bootstrap confidence intervals).

Output S₁: λ γ C C_d α S_T: λ γ C C_d α Σ S₁
2015-2024 warming 0.547 0.056 0.006 0.007 0.327 0.598 0.073 0.008 0.013 0.365 0.943
2081-2100 warming, SSP2-4.5 0.881 0.042 0.000 0.025 0.020 0.908 0.062 0.001 0.037 0.024 0.968

Projections: the fan chart, and what it can't say
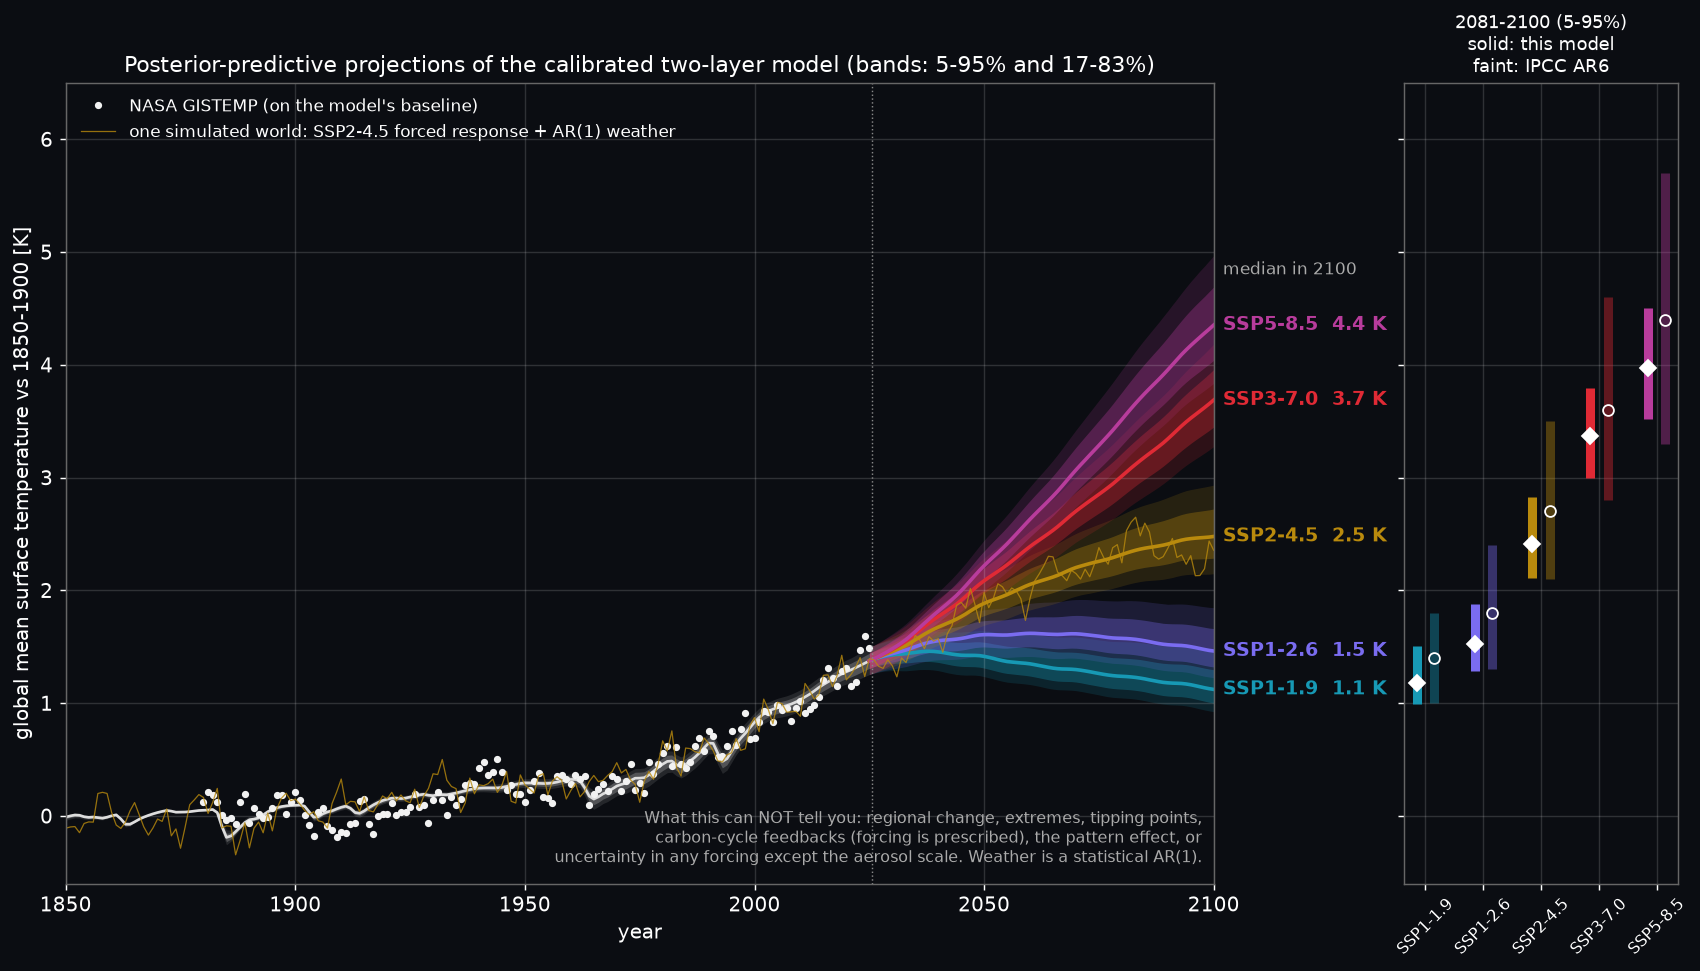
projections

Warming 2081-2100 relative to 1850-1900 (median [5 %, 95 %]), 3 000 posterior draws per scenario:

Scenario This model IPCC AR6 (SPM Table SPM.1)
SSP1-1.9 1.18 [0.99, 1.51] 1.4 [1.0, 1.8]
SSP1-2.6 1.52 [1.29, 1.88] 1.8 [1.3, 2.4]
SSP2-4.5 2.42 [2.11, 2.83] 2.7 [2.1, 3.5]
SSP3-7.0 3.37 [3.00, 3.80] 3.6 [2.8, 4.6]
SSP5-8.5 3.97 [3.52, 4.50] 4.4 [3.3, 5.7]

Every median is 0.2 to 0.4 K below AR6 and every range is narrower, especially at the top. Both follow from what the model leaves out:

So the honest headline is: given this model structure and these priors, the historical record implies roughly the AR6 central warming, somewhat lower, with an uncertainty range we know to be too narrow.

7. Run it

# from SimulationLab/
uv run python L07_earths_thermostat/sim.py

Runtime: 232 s (≈ 4 min wall-clock with uv start-up) on the 8-core dev machine while other agents were running, using 3 Numba threads. Measured breakdown from the section timestamps the script prints: main MCMC 23 s (1.9 M walker-steps), white-noise MCMC 8 s, synthetic recovery 9 s, coverage test 122 s (40 MCMCs, ~3 s each), static figures 14 s, Sobol + OAT ~1 s (28 672 + 210 model runs), projections < 1 s, MP4 51 s. The first run also downloads 1.3 MB (9 files) into data/. Delete a file there to refresh it; otherwise reruns are offline. Everything is seeded (SEED = 2021), and the numbers above reproduce exactly (only the section timings vary).

Outputs in output/: hero.png, projections.png, data_and_forcing.png, mcmc_diagnostics.png, corner.png, posterior_predictive.png, synthetic_truth.png, ecs_tcr_vs_ar6.png, sobol_vs_oat.png, mcmc_walkers.mp4, posterior_summary.csv. The script ends with a PASS/FAIL/REPORT table and raises AssertionError if any check fails:

Check Expected Got
AR6 CO₂ ERF = k ln(C/C₀) on Mauna Loa CO₂ R² > 0.99 R² = 0.99985 PASS
implied F₂ₓ = k ln 2 vs AR6 [3.46, 4.40] inside 3.81 W m⁻² PASS
exact integrator vs scipy.linalg.expm (abrupt 4×CO₂, 5000 yr) < 1e-9 K 4.4e-14 K PASS
equilibrium after 5000 yr, T / (F/λ) 1 ± 1e-4 1.000000 PASS
SALib Sobol on Ishigami vs analytic S₁, S_T < 0.02 0.0023 PASS
emcee: no stuck walkers (acceptance of every walker) > 0.05 min 0.113, mean 0.131 PASS
chain length after burn-in / τ_max > 50 113 PASS
no walker parked in a side mode after burn-in median log-prob gap < 5 0.43 PASS
GISTEMP inside the 90% posterior predictive band 0.80 to 0.98 0.932 PASS
energy imbalance 2006-2018 median vs AR6 [0.52, 1.06] (out of sample) inside 0.76 W m⁻² PASS
forced warming 2011-2020 vs AR6 [0.95, 1.20] inside 1.17 K PASS
synthetic truth inside 90% CI (10 quantities) ≥ 8 of 10 10 of 10 PASS
synthetic truth inside 99% CI 10 of 10 10 of 10 PASS
90% CI coverage over 40 prior-drawn worlds (ECS, TCR, α, σ) ≥ 30/40 each 37/37/36/36 PASS
TCR median inside AR6 very likely [1.2, 2.4] inside 1.60 K PASS
(reported) white-noise likelihood, TCR 90% range narrower ×0.58 REPORT
(reported) whitened residuals, max |ACF| lags 1-10 < 0.16 0.25 at lag 4 miss (ENSO)
(reported) ECS median inside AR6 likely [2.5, 4.0] inside 2.17 K miss (pattern effect)

8. Code tour (sim.py)

Function What it does
fetch, load_data cached requests download; pandas parsing of GISTEMP (*** gaps), NOAA (# header), IPCC ERF and CMIP6 tables
groups, build_forcing, split ERF → CO₂ / other / aerosol / natural; Mauna Loa log-law fit and 2020-2025 extension; SSP splicing with a tapered offset; (non-aerosol, aerosol) arrays for the model
ebm the model: Numba prange kernel, exact exponential map per parameter set, annual-mean output
model, tcr, timescales contiguous-array wrapper; 1 %/yr CO₂ experiment; fast/slow mode e-folding times
cmip6_prior, log_prior, sample_prior CMIP6-informed lognormals; hard prior box; rejection sampler (used for walker starts, prior overlays and coverage truths)
log_like, log_prob exact AR(1) Gaussian likelihood; vectorised posterior (only in-prior walkers run the model)
run_mcmc, posterior emcee sampler (DE + snooker moves, seeded, optional ρ = 0); burn-in, τ, thinning
verify_integrator, verify_sobol closed form vs scipy.linalg.expm; SALib vs the analytic Ishigami indices
posterior_predictive replicated records, band coverage, trend and ACF test statistics, whitened residuals, energy imbalance
synthetic_recovery, coverage_test known-truth MCMC with contraction ratios; 40 prior-drawn worlds for interval coverage
sensitivity, warming SALib Sobol for two outputs; one-at-a-time sweeps at two nominal points
projections 3 000 posterior draws × 5 SSPs, rebased to 1850-1900; one noisy "simulated world"
main the pipeline, printed numbers and the PASS/FAIL table
fig_*, make_hero, mp4_walkers, credible_contours, fan, spread plotting only

9. Simplifications & ceilings

10. Go further

  1. Rebuild it in FaIR. pip install fair (v2), drive it with the same SSP ERF files, and compare its AR6-calibrated ensemble with our posterior. Then calibrate FaIR's 3-layer EBM with this script's emcee setup.
  2. Add ocean heat to the likelihood. Use NOAA NCEI 0-2000 m ocean heat content, or the von Schuckmann et al. (2023) Earth heat inventory, as a second data stream with its own noise model. Measure how much the posteriors of γ and C_d contract, and whether ECS moves.
  3. Add the pattern effect. Give the model efficacy ε with a CMIP6-informed prior, or let λ drift over time. How close does ECS get to AR6's 3 K, and how much wider do the projections become?
  4. Rewrite in PyMC or Stan. Write the time loop as pytensor.scan or a Stan for loop, sample with NUTS, then use ArviZ for R-hat and ESS. Compare effective samples per second with emcee's.
  5. Emulate an expensive model. Pretend each run costs an hour. Fit a Gaussian-process or polynomial-chaos surrogate on 200 runs (UQLab, OpenTURNS or scikit-learn), run Sobol and MCMC on the surrogate, and check against the exact numbers here.

11. References

Every output

Source code

sim.py 1,098 lines
"""
L07 - Earth's Thermostat: Bayesian calibration of a two-layer climate model on real data.

  live data (NASA GISTEMP, NOAA Mauna Loa CO2, IPCC AR6 forcing, cached in data/)
  -> two-layer energy-balance model (Held 2010 / Geoffroy 2013), exact exponential integrator
  -> emcee posterior with an AR(1) noise likelihood -> MCMC diagnostics
  -> posterior predictive checks + out-of-sample energy-imbalance check
  -> synthetic-truth recovery and a coverage test -> ECS / TCR vs IPCC AR6
  -> SALib Sobol indices vs one-at-a-time -> SSP projection fan charts.

Run from the repo root:   uv run python L07_earths_thermostat/sim.py
"""
import os

os.environ.setdefault("NUMBA_NUM_THREADS", "3")  # CPU etiquette: the machine is shared
os.environ.setdefault("OMP_NUM_THREADS", "1")

import time
from pathlib import Path

import emcee
import imageio_ffmpeg
import matplotlib

matplotlib.use("Agg")
import matplotlib.pyplot as plt
import numpy as np
import pandas as pd
import requests
from matplotlib import animation
from matplotlib.colors import LinearSegmentedColormap
from numba import njit, prange
from SALib.analyze import sobol as sobol_analyze
from SALib.sample import sobol as sobol_sample
from SALib.test_functions import Ishigami
from scipy.linalg import expm
from scipy.ndimage import gaussian_filter

HERE = Path(__file__).parent
DATA, OUT = HERE / "data", HERE / "output"
SEED = 2021  # the year IPCC AR6 WG1 came out

GISTEMP_URL = "https://data.giss.nasa.gov/gistemp/tabledata_v4/GLB.Ts+dSST.csv"
CO2_URL = "https://gml.noaa.gov/webdata/ccgg/trends/co2/co2_annmean_mlo.csv"
IPCC = "https://raw.githubusercontent.com/IPCC-WG1/Chapter-7/main/data_output/"
AR6_URL = IPCC + "AR6_ERF_1750-2019.csv"
SSP_URL = IPCC + "SSPs/ERF_{}_1750-2500.csv"
CMIP6_URL = IPCC + "cmip6_twolayer_tuning_params.csv"

# name, colour (validated for CVD on a dark surface; every fan is also direct-labelled)
SCENARIOS = {"ssp119": ("SSP1-1.9", "#1799b5"), "ssp126": ("SSP1-2.6", "#7a6cf0"),
             "ssp245": ("SSP2-4.5", "#b98a0d"), "ssp370": ("SSP3-7.0", "#e02a35"),
             "ssp585": ("SSP5-8.5", "#b83c9c")}
F2X = 3.93  # AR6 effective radiative forcing of doubled CO2 [W m-2] (sec. 7.3.2.1)
CO2_PI = 278.3  # AR6 1750 CO2 [ppm]
# IPCC AR6 assessments: (5%, 17%, best, 83%, 95%) for ECS/TCR [K], (5%, best, 95%) otherwise
AR6_ECS = (2.0, 2.5, 3.0, 4.0, 5.0)
AR6_TCR = (1.2, 1.4, 1.8, 2.2, 2.4)
AR6_2081_2100 = {"ssp119": (1.0, 1.4, 1.8), "ssp126": (1.3, 1.8, 2.4), "ssp245": (2.1, 2.7, 3.5),
                 "ssp370": (2.8, 3.6, 4.6), "ssp585": (3.3, 4.4, 5.7)}  # SPM Table SPM.1
AR6_WARMING_2011_2020 = (0.95, 1.09, 1.20)  # observed GSAT vs 1850-1900 (SPM A.1.2)
AR6_EEI = {(1971, 2018): (0.43, 0.57, 0.72), (2006, 2018): (0.52, 0.79, 1.06)}  # Table 7.1 [W m-2]

NAMES = ["lam", "gamma", "C", "C_d", "alpha", "T0", "sigma", "rho"]
LABELS = [r"$\lambda$ [W m$^{-2}$K$^{-1}$]", r"$\gamma$ [W m$^{-2}$K$^{-1}$]",
          r"$C$ [W yr m$^{-2}$K$^{-1}$]", r"$C_d$ [W yr m$^{-2}$K$^{-1}$]", r"$\alpha_{aer}$",
          r"$T_0$ [K]", r"$\sigma$ [K]", r"$\rho$"]
# hard prior box; inside it: lambda ~ U, gamma/C/C_d ~ lognormal (CMIP6), alpha ~ N(1, 0.35), rest ~ U
LO = np.array([0.2, 0.05, 1.0, 5.0, 0.0, -1.0, 0.01, 0.0])
HI = np.array([4.0, 5.0, 40.0, 1000.0, 3.0, 1.0, 0.3, 0.95])
ALPHA_SD = 0.35  # AR6 aerosol ERF 1750-2019: -1.1 [-1.7, -0.4] W m-2 -> ~35% (1 sigma) on the scale
TRUTH = np.array([1.3, 0.7, 8.0, 100.0, 1.0, -0.35, 0.09, 0.5])  # synthetic Earth, ECS = 3.02 K


# =============================================================================================
# 1. Data: download once, cache in data/, parse with pandas
# =============================================================================================
def fetch(url):
    """Download once, then reuse the cached copy in data/ (delete the file to refresh)."""
    path = DATA / url.rsplit("/", 1)[-1]
    if not path.exists():
        print(f"  downloading {url}")
        r = requests.get(url, timeout=60)
        r.raise_for_status()
        DATA.mkdir(exist_ok=True)
        path.write_bytes(r.content)
    return path


def load_data():
    gis = pd.read_csv(fetch(GISTEMP_URL), skiprows=1, na_values="***")
    gis = gis.set_index("Year")["J-D"].dropna()  # Jan-Dec means, complete years only [K vs 1951-80]
    co2 = pd.read_csv(fetch(CO2_URL), comment="#").set_index("year")["mean"]  # [ppm]
    erf = pd.read_csv(fetch(AR6_URL), index_col="year")
    ssp = {s: pd.read_csv(fetch(SSP_URL.format(s)), index_col="year") for s in SCENARIOS}
    cmip6 = pd.read_csv(fetch(CMIP6_URL), index_col=0).drop(["Mean", "StDev"])  # summary rows, not models
    last = int(min(gis.index[-1], co2.index[-1]))
    return gis.loc[:last], co2, erf, ssp, cmip6, last


def groups(df):
    """ERF table -> the four groups the model and the figures use [W m-2]."""
    aer = df["aerosol-radiation_interactions"] + df["aerosol-cloud_interactions"]
    nat = df["volcanic"] + df["solar"]
    return pd.DataFrame({"co2": df["co2"], "other": df["total"] - df["co2"] - aer - nat,
                         "aer": aer, "nat": nat})


def build_forcing(erf, ssp, co2, last):
    """Historical ERF 1750..last plus one 1750-2100 run per SSP scenario.

    1750-2019: IPCC AR6 assessed ERF. 2020..last: CO2 from the *measured* Mauna Loa record via a
    log law fitted to AR6 (below); every other agent from SSP2-4.5 (a scenario, not an observation).
    After `last` each SSP takes over; the offset at the splice tapers linearly to zero by 2050.
    """
    hist = groups(erf)
    both = co2.index.intersection(hist.index)
    x, y = np.log(co2[both] / CO2_PI).to_numpy(), hist["co2"][both].to_numpy()
    k = (x @ y) / (x @ x)  # least squares through the origin: F_co2 = k ln(C / C_1750)
    r2 = 1 - ((y - k * x) ** 2).sum() / ((y - y.mean()) ** 2).sum()
    ext = groups(ssp["ssp245"]).loc[2020:last].copy()
    ext["co2"] = hist["co2"][2019] + k * np.log(co2.loc[2020:last] / co2[2019])
    hist = pd.concat([hist, ext])
    runs = {}
    for s in SCENARIOS:
        g = groups(ssp[s])
        fut = g.loc[last + 1:2100]
        # ponytail: linear taper of the seam offset (up to 0.27 W m-2 per group), per-agent
        # harmonisation of the SSP pathways (as FaIR/aneris do) if the 2025-2050 detail matters
        w = np.clip((2050 - fut.index.to_numpy()) / (2050 - last), 0, 1)
        runs[s] = pd.concat([hist, fut + np.outer(w, hist.loc[last] - g.loc[last])])
    return hist, runs, dict(k=k, r2=r2, x=x, y=y, years=both.to_numpy(), ext=ext,
                            ssp245_co2=groups(ssp["ssp245"])["co2"].loc[2020:last])


def split(F):
    """Forcing frame -> (non-aerosol, aerosol) arrays, the two inputs of the model."""
    return (F.sum(axis=1) - F["aer"]).to_numpy(), F["aer"].to_numpy()


# =============================================================================================
# 2. The model: two-layer energy balance, integrated exactly
# =============================================================================================
@njit(parallel=True, fastmath=False, cache=False)
def ebm(theta, fna, fa):
    """Two-layer energy-balance model, one parameter set per row of theta, annual forcing.

        C   dT/dt   = F - lam T - gam (T - T_d)        (mixed layer + atmosphere)
        C_d dT_d/dt =             gam (T - T_d)        (deep ocean)
        F = fna + alpha * fa                           (aerosol ERF scaled by alpha)

    The system is linear, x' = A x + B F, so with F held constant over each year the exact
    one-year map is x_{n+1} = Phi x_n + G F_n with Phi = exp(A) (Sylvester's formula for a 2x2
    with real distinct eigenvalues m1, m2) and G = A^-1 (Phi - I) B. No time-step error at all.
    Returns annual-mean surface temperature (mean of the start/end-of-year states) [K].
    """
    n, nt = theta.shape[0], fna.shape[0]
    out = np.empty((n, nt))
    for i in prange(n):
        lam, gam, C, Cd, alpha = theta[i, 0], theta[i, 1], theta[i, 2], theta[i, 3], theta[i, 4]
        a, b, c, d = -(lam + gam) / C, gam / C, gam / Cd, -gam / Cd  # A = [[a, b], [c, d]]
        det = a * d - b * c  # = lam gam / (C C_d) > 0
        h = np.sqrt(0.25 * (a + d) ** 2 - det)
        m1, m2 = 0.5 * (a + d) + h, 0.5 * (a + d) - h  # slow and fast mode rates (< 0)
        e1, e2 = np.exp(m1), np.exp(m2)
        p00 = (e1 * (a - m2) - e2 * (a - m1)) / (m1 - m2)
        p01 = b * (e1 - e2) / (m1 - m2)
        p10 = c * (e1 - e2) / (m1 - m2)
        p11 = (e1 * (d - m2) - e2 * (d - m1)) / (m1 - m2)
        q0, q1 = (p00 - 1.0) / C, p10 / C  # (Phi - I) B
        g0, g1 = (d * q0 - b * q1) / det, (-c * q0 + a * q1) / det  # A^-1 (Phi - I) B
        T, Td = 0.0, 0.0  # pre-industrial (1750) equilibrium
        for t in range(nt):
            F = fna[t] + alpha * fa[t]
            Tn = p00 * T + p01 * Td + g0 * F
            Td = p10 * T + p11 * Td + g1 * F
            out[i, t] = 0.5 * (T + Tn)
            T = Tn
    return out


def model(theta, fna, fa):
    return ebm(np.ascontiguousarray(np.atleast_2d(theta), dtype=np.float64), fna, fa)


def tcr(theta):
    """Transient climate response: warming around year 70 of a 1 %/yr CO2 ramp (years 61-80)."""
    F = F2X * (np.arange(140) + 0.5) * np.log(1.01) / np.log(2)
    return model(theta, F, np.zeros_like(F))[:, 60:80].mean(1)


def timescales(theta):
    """Fast and slow e-folding times [yr] of the two modes (Geoffroy et al. 2013a)."""
    lam, gam, C, Cd = theta[:, 0], theta[:, 1], theta[:, 2], theta[:, 3]
    tr, det = -(lam + gam) / C - gam / Cd, lam * gam / (C * Cd)
    h = np.sqrt(0.25 * tr**2 - det)
    return -1 / (0.5 * tr - h), -1 / (0.5 * tr + h)


# =============================================================================================
# 3. The Bayesian pieces: prior, AR(1) likelihood, posterior, sampler
# =============================================================================================
def cmip6_prior(cmip6):
    """Lognormal (mu, sd) for gamma, C, C_d from 35 CMIP6 two-layer fits, log-spread doubled.

    ponytail: x2 is a judgement call. A model ensemble shares structural biases, so its spread
    understates real-world uncertainty; doubling lets the data pull outside the model family.
    """
    logs = np.log(cmip6[["gamma_2l", "cmix", "cdeep"]].to_numpy())
    return logs.mean(0), 2.0 * logs.std(0)


def log_prior(th, pri):
    mu, sd = pri
    inside = np.all((th >= LO) & (th < HI), axis=1)
    z = np.log(np.abs(th[:, 1:4]) + 1e-300)  # rows outside the box are masked below
    lp = -(z + 0.5 * ((z - mu) / sd) ** 2).sum(1) - 0.5 * ((th[:, 4] - 1.0) / ALPHA_SD) ** 2
    return np.where(inside, lp, -np.inf)


def sample_prior(n, pri, rng):
    mu, sd = pri
    out = np.empty((0, 8))
    while len(out) < n:  # rejection keeps the draws inside the hard box
        m = 4 * n
        th = np.column_stack([rng.uniform(LO[0], HI[0], m), np.exp(rng.normal(mu, sd, (m, 3))),
                              rng.normal(1.0, ALPHA_SD, m), rng.uniform(LO[5:], HI[5:], (m, 3))])
        out = np.vstack([out, th[np.isfinite(log_prior(th, pri))]])
    return out[:n]


def log_like(th, obs, idx, fna, fa):
    """Exact AR(1) Gaussian likelihood of the residuals r_t = obs_t - (T_model,t + T0).

    r_t = rho r_{t-1} + e_t with e_t ~ N(0, sigma^2), and r_1 drawn from the stationary law
    N(0, sigma^2 / (1 - rho^2)). Whitening: e_t = r_t - rho r_{t-1} must look like white noise.
    """
    r = obs - (model(th, fna, fa)[:, idx] + th[:, 5:6])
    s, rho = th[:, 6], th[:, 7]
    e = r[:, 1:] - rho[:, None] * r[:, :-1]
    n = r.shape[1]
    return (-0.5 * ((e**2).sum(1) + (1 - rho**2) * r[:, 0] ** 2) / s**2 - n * np.log(s)
            + 0.5 * np.log(1 - rho**2) - 0.5 * n * np.log(2 * np.pi))


def log_prob(th, obs, idx, fna, fa, pri):
    """Vectorised over walkers: th is (walkers, 8). Only walkers inside the prior run the model."""
    lp = log_prior(th, pri)
    ok = np.isfinite(lp)
    if ok.any():
        lp[ok] += log_like(th[ok], obs, idx, fna, fa)
    return lp


def run_mcmc(obs, idx, fna, fa, pri, nsteps, nwalkers=48, seed=SEED, white=False):
    """emcee ensemble sampler, walkers started from prior draws (over-dispersed on purpose).

    white=True fixes rho = 0 (i.e. pretends the residuals are independent) for comparison.
    """
    rng = np.random.default_rng(seed)
    p0 = sample_prior(nwalkers, pri, rng)

    def lp(th):
        if white:
            th = np.column_stack([th, np.zeros(len(th))])
        return log_prob(th, obs, idx, fna, fa, pri)

    ndim = 7 if white else 8
    moves = [(emcee.moves.DEMove(), 0.8), (emcee.moves.DESnookerMove(), 0.2)]  # emcee docs' mix
    sampler = emcee.EnsembleSampler(nwalkers, ndim, lp, vectorize=True, moves=moves)
    sampler.random_state = np.random.RandomState(seed).get_state()  # reproducible
    sampler.run_mcmc(p0[:, :ndim], nsteps, progress=False)
    return sampler


def posterior(sampler, burn, white=False):
    """Flat posterior after burn-in, thinned by ~tau/2; rho = 0 column added for white runs."""
    tau = sampler.get_autocorr_time(discard=burn, tol=0)
    flat = sampler.get_chain(discard=burn, thin=max(1, int(tau.max() / 2)), flat=True)
    if white:
        flat = np.column_stack([flat, np.zeros(len(flat))])
    return flat, tau


def ci(x, q=(5, 50, 95)):
    return np.percentile(x, q)


def ar1_noise(sig, rho, n, rng):
    e = np.empty((len(sig), n))
    e[:, 0] = rng.normal(0, sig / np.sqrt(1 - rho**2))
    for t in range(1, n):
        e[:, t] = rho * e[:, t - 1] + rng.normal(0, sig)
    return e


# =============================================================================================
# 4. Verification
# =============================================================================================
def verify_integrator():
    """Our closed-form exponential map vs scipy.linalg.expm for an abrupt-4xCO2 step."""
    th = np.array([[1.3, 0.7, 8.0, 100.0, 1.0]])
    lam, gam, C, Cd = th[0, :4]
    A = np.array([[-(lam + gam) / C, gam / C], [gam / Cd, -gam / Cd]])
    B = np.array([1 / C, 0.0])
    F = 2 * F2X
    nt = 5000
    T_num = model(th, np.full(nt, F), np.zeros(nt))[0]
    x = np.array([np.linalg.solve(A, (expm(A * t) - np.eye(2)) @ B * F)[0] for t in range(nt + 1)])
    err = np.abs(T_num - 0.5 * (x[:-1] + x[1:])).max()
    eq = T_num[-1] / (F / lam)  # after 5000 yr the slow mode (~a few hundred yr) is gone
    return err, eq


def verify_sobol():
    """SALib Sobol on the Ishigami function (a=7, b=0.1) vs its analytic indices."""
    prob = {"num_vars": 3, "names": ["x1", "x2", "x3"], "bounds": [[-np.pi, np.pi]] * 3}
    X = sobol_sample.sample(prob, 8192, calc_second_order=False, seed=SEED)
    Si = sobol_analyze.analyze(prob, Ishigami.evaluate(X), calc_second_order=False, seed=SEED)
    exact_s1, exact_st = np.array([0.3139, 0.4424, 0.0]), np.array([0.5576, 0.4424, 0.2437])
    return max(np.abs(Si["S1"] - exact_s1).max(), np.abs(Si["ST"] - exact_st).max())


# =============================================================================================
# 5. Main pipeline
# =============================================================================================
def main():
    t_start = time.time()
    OUT.mkdir(exist_ok=True)
    plt.style.use("dark_background")
    plt.rcParams.update({"font.size": 11, "axes.grid": True, "grid.alpha": 0.15, "axes.titlesize": 12,
                         "figure.facecolor": "#0b0d12", "axes.facecolor": "#0b0d12",
                         "savefig.facecolor": "#0b0d12", "axes.edgecolor": "#666",
                         "legend.frameon": False})
    rng = np.random.default_rng(SEED)
    checks = []  # (name, expected, got, pass)

    print(f"[{time.time() - t_start:4.0f} s] == 1. data")
    gis, co2, erf, ssp, cmip6, last = load_data()
    hist, runs, co2fit = build_forcing(erf, ssp, co2, last)
    years = hist.index.to_numpy()
    fna, fa = split(hist)
    idx = (gis.index.to_numpy() - 1750).astype(int)
    obs = gis.to_numpy()
    pri = cmip6_prior(cmip6)
    print(f"  GISTEMP {gis.index[0]}-{last} ({len(obs)} yr), Mauna Loa CO2 {co2.index[0]}-{co2.index[-1]}, "
          f"AR6 ERF 1750-2019 + extension to {last}")
    f2x_fit = co2fit["k"] * np.log(2)
    print(f"  CO2 log law fitted to AR6 with Mauna Loa: k = {co2fit['k']:.3f} W/m2, R2 = {co2fit['r2']:.5f}, "
          f"implied F2x = {f2x_fit:.2f} W/m2")
    d_co2 = (co2fit["ext"]["co2"] - co2fit["ssp245_co2"]).to_numpy()
    print(f"  measured-CO2 ERF minus SSP2-4.5 CO2 ERF, 2020-{last}: {d_co2.min():+.3f} .. {d_co2.max():+.3f} W/m2")
    checks.append(("AR6 CO2 ERF = k ln(C/C0) on Mauna Loa CO2", "R2 > 0.99", f"R2 = {co2fit['r2']:.4f}",
                   co2fit["r2"] > 0.99))
    checks.append(("implied F2x = k ln 2 vs AR6 3.93 [3.46, 4.40]", "inside", f"{f2x_fit:.2f} W/m2",
                   3.46 <= f2x_fit <= 4.40))
    fig_data(hist, co2, co2fit, gis, last)

    print(f"[{time.time() - t_start:4.0f} s] == 2. verification of the tools")
    err, eq = verify_integrator()
    print(f"  exact integrator vs scipy expm (abrupt 4xCO2, 5000 yr): max error {err:.2e} K, T/T_eq = {eq:.6f}")
    checks.append(("two-layer integrator vs scipy.linalg.expm", "< 1e-9 K", f"{err:.1e} K", err < 1e-9))
    checks.append(("equilibrium after 5000 yr: T / (F/lam)", "1 +- 1e-4", f"{eq:.6f}", abs(eq - 1) < 1e-4))
    s_err = verify_sobol()
    print(f"  SALib Sobol on Ishigami: max |S - exact| = {s_err:.4f}")
    checks.append(("SALib Sobol S1/ST on Ishigami vs analytic", "< 0.02", f"{s_err:.4f}", s_err < 0.02))

    print(f"[{time.time() - t_start:4.0f} s] == 3. MCMC on the real record")
    t0 = time.time()
    NSTEP, BURN = 30000, 10000  # one walker sat in a spurious high-rho mode until step ~7400
    samp = run_mcmc(obs, idx, fna, fa, pri, NSTEP, nwalkers=64)
    post, tau = posterior(samp, BURN)
    acc = samp.acceptance_fraction
    print(f"  64 walkers x {NSTEP} steps in {time.time() - t0:.1f} s; acceptance {acc.mean():.3f} "
          f"[{acc.min():.2f}-{acc.max():.2f}]; tau = " + ", ".join(f"{n} {t:.0f}" for n, t in zip(NAMES, tau)))
    print(f"  kept {len(post)} samples (burn {BURN}, thin {max(1, int(tau.max() / 2))}); "
          f"(N - burn)/tau_max = {(NSTEP - BURN) / tau.max():.0f}")
    checks.append(("emcee acceptance: no stuck walkers", "every walker > 0.05", f"min {acc.min():.3f}, mean {acc.mean():.3f}",
                   acc.min() > 0.05))
    checks.append(("chain length after burn-in / tau_max", "> 50", f"{(NSTEP - BURN) / tau.max():.0f}",
                   (NSTEP - BURN) / tau.max() > 50))
    lp = samp.get_log_prob()
    gap = np.median(lp[BURN:]) - np.median(lp[BURN:], axis=0).min()  # worst walker vs the ensemble
    stuck = [(w, int(np.where(lp[:, w] < np.median(lp, axis=1) - 15)[0].max()))
             for w in range(lp.shape[1]) if (lp[:, w] < np.median(lp, axis=1) - 15)[2000:].sum() > 200]
    print(f"  walkers >15 log-units below the ensemble for >200 steps after step 2000 (walker, last such step): {stuck}")
    checks.append(("no walker parked in a side mode after burn-in", "worst walker median lp gap < 5",
                   f"{gap:.2f}", gap < 5))
    ecs, tc = F2X / post[:, 0], tcr(post)
    t_fast, t_slow = timescales(post)
    for n, lab, x in zip(NAMES + ["ECS", "TCR", "tau_fast", "tau_slow"], NAMES + ["ECS", "TCR", "tau_f", "tau_s"],
                         list(post.T) + [ecs, tc, t_fast, t_slow]):
        lo, md, hi = ci(x)
        print(f"  {lab:>8s}: {md:8.3f}  [5-95%: {lo:8.3f}, {hi:8.3f}]")
    summary = pd.DataFrame({n: ci(x, (5, 17, 50, 83, 95)) for n, x in
                            zip(NAMES + ["ECS", "TCR"], list(post.T) + [ecs, tc])},
                           index=["p05", "p17", "p50", "p83", "p95"]).T
    summary.to_csv(OUT / "posterior_summary.csv", float_format="%.4f")

    print(f"[{time.time() - t_start:4.0f} s] == 4. white-noise likelihood (rho = 0) for comparison")
    samp_w = run_mcmc(obs, idx, fna, fa, pri, 15000, nwalkers=48, white=True)
    post_w, _ = posterior(samp_w, 7000, white=True)
    ecs_w, tc_w = F2X / post_w[:, 0], tcr(post_w)
    for n, a, b in [("ECS", ecs, ecs_w), ("TCR", tc, tc_w), ("alpha", post[:, 4], post_w[:, 4]),
                    ("T0", post[:, 5], post_w[:, 5]), ("C", post[:, 2], post_w[:, 2])]:
        qa, qb = ci(a), ci(b)
        print(f"  {n:>5s}: AR(1) {qa[1]:.3f} [{qa[0]:.3f}, {qa[2]:.3f}]  white {qb[1]:.3f} [{qb[0]:.3f}, "
              f"{qb[2]:.3f}]  width ratio white/AR(1) {(qb[2] - qb[0]) / (qa[2] - qa[0]):.2f}")
    print(f"  white-noise sigma {np.median(post_w[:, 6]):.3f} vs AR(1) innovation sigma {np.median(post[:, 6]):.3f}")
    wr = np.diff(ci(tc_w, (5, 95)))[0] / np.diff(ci(tc, (5, 95)))[0]
    checks.append(("(reported) white-noise likelihood: TCR 90% range vs AR(1)", "narrower (overconfident)",
                   f"x{wr:.2f}", None))

    print(f"[{time.time() - t_start:4.0f} s] == 5. posterior predictive checks")
    ppc = posterior_predictive(post, obs, idx, fna, fa, gis, years, rng)
    print(f"  obs inside 90% predictive band: {ppc['inside']:.3f}; trend 1975-{last} obs {ppc['t_obs']:.3f} "
          f"K/dec, p = {ppc['p_trend']:.2f}; lag-1 ACF obs {ppc['a_obs']:.2f}, p = {ppc['p_acf']:.2f}")
    print(f"  whitened-residual lag-1 ACF {ppc['acf_white'][1]:+.2f} (raw {ppc['acf_raw'][1]:+.2f}); "
          f"Ljung-Box-style max |ACF| lags 1-10 whitened {np.abs(ppc['acf_white'][1:11]).max():.2f}")
    for (a, b), (lo, md, hi) in AR6_EEI.items():
        q = ci(ppc["eei"][(a, b)])
        print(f"  Earth energy imbalance {a}-{b}: posterior {q[1]:.2f} [{q[0]:.2f}, {q[2]:.2f}] W/m2 "
              f"vs AR6 {md} [{lo}, {hi}]")
    checks.append(("obs inside 90% posterior predictive band", "0.80-0.98", f"{ppc['inside']:.3f}",
                   0.80 <= ppc["inside"] <= 0.98))
    worst = np.argmax(np.abs(ppc["acf_white"][1:11])) + 1
    checks.append(("(reported) whitened residuals white: max |ACF| lags 1-10", f"< {1.96 / np.sqrt(ppc['n']):.2f}",
                   f"{np.abs(ppc['acf_white'][worst]):.2f} at lag {worst}", None))
    q = ci(ppc["eei"][(2006, 2018)])
    checks.append(("EEI 2006-2018 median vs AR6 [0.52, 1.06] (out of sample)", "inside", f"{q[1]:.2f} W/m2",
                   0.52 <= q[1] <= 1.06))
    w1120 = ci(ppc["w2011_2020"])
    print(f"  model warming 2011-2020 vs 1850-1900: {w1120[1]:.2f} [{w1120[0]:.2f}, {w1120[2]:.2f}] K "
          f"vs AR6 1.09 [0.95, 1.20]")
    checks.append(("forced warming 2011-2020 vs AR6 1.09 [0.95, 1.20] K", "inside", f"{w1120[1]:.2f} K",
                   0.95 <= w1120[1] <= 1.20))

    print(f"[{time.time() - t_start:4.0f} s] == 6. synthetic-truth recovery")
    syn = synthetic_recovery(idx, fna, fa, pri, rng)
    for n, (lo, md, hi), tv, c in zip(syn["names"], syn["q"], syn["truth"], syn["contraction"]):
        print(f"  {n:>6s}: truth {tv:8.3f}  posterior {md:8.3f} [90%: {lo:8.3f}, {hi:8.3f}]  "
              f"sd(post)/sd(prior) {c:.2f}")
    n_in = int(sum(lo <= tv <= hi for (lo, _, hi), tv in zip(syn["q"], syn["truth"])))
    n_99 = int(sum(lo <= tv <= hi for (lo, hi), tv in zip(syn["q99"], syn["truth"])))
    checks.append(("synthetic truth inside 90% CI (10 quantities)", "~9 of 10", f"{n_in} of 10", n_in >= 8))
    checks.append(("synthetic truth inside 99% CI (10 quantities)", "10 of 10", f"{n_99} of 10", n_99 == 10))
    print(f"[{time.time() - t_start:4.0f} s]    coverage test (40 synthetic worlds)")
    cov = coverage_test(idx, fna, fa, pri)
    K = cov["K"]
    lo_b = int(np.floor(np.percentile(np.random.default_rng(0).binomial(K, 0.9, 100000), 0.5)))
    for n, h in cov["hits"].items():
        print(f"  coverage of 90% CI over {K} prior-drawn truths, {n}: {h}/{K}")
    checks.append((f"90% CI coverage over {K} synthetic worlds (ECS, TCR, alpha, sigma)",
                   f">= {lo_b}/{K} each (binomial 99%)", "/".join(str(h) for h in cov["hits"].values()),
                   all(h >= lo_b for h in cov["hits"].values())))
    fig_synthetic(syn, cov)

    print(f"[{time.time() - t_start:4.0f} s] == 7. ECS / TCR vs IPCC AR6")
    prior_s = sample_prior(20000, pri, rng)
    ecs_p, tcr_p = F2X / prior_s[:, 0], tcr(prior_s)
    q_ecs, q_tcr = ci(ecs, (5, 17, 50, 83, 95)), ci(tc, (5, 17, 50, 83, 95))
    print(f"  ECS posterior {q_ecs[2]:.2f} K, 66%: [{q_ecs[1]:.2f}, {q_ecs[3]:.2f}], 90%: [{q_ecs[0]:.2f}, "
          f"{q_ecs[4]:.2f}]   AR6: 3.0, likely [2.5, 4.0], very likely [2.0, 5.0]")
    print(f"  TCR posterior {q_tcr[2]:.2f} K, 66%: [{q_tcr[1]:.2f}, {q_tcr[3]:.2f}], 90%: [{q_tcr[0]:.2f}, "
          f"{q_tcr[4]:.2f}]   AR6: 1.8, likely [1.4, 2.2], very likely [1.2, 2.4]")
    print(f"  P(ECS < 2) = {np.mean(ecs < 2):.2f}, P(2.5 <= ECS <= 4) = {np.mean((ecs >= 2.5) & (ecs <= 4)):.2f}, "
          f"P(ECS > 4) = {np.mean(ecs > 4):.3f}, P(ECS > 5) = {np.mean(ecs > 5):.3f}; "
          f"P(1.4 <= TCR <= 2.2) = {np.mean((tc >= 1.4) & (tc <= 2.2)):.2f}")
    print(f"  aerosol ERF 2019 = alpha x {hist['aer'][2019]:.2f} = {np.median(post[:, 4]) * hist['aer'][2019]:.2f} "
          f"[{ci(post[:, 4] * hist['aer'][2019])[2]:.2f}, {ci(post[:, 4] * hist['aer'][2019])[0]:.2f}] W/m2 "
          f"(AR6: -1.1 [-1.7, -0.4])")
    checks.append(("TCR median inside AR6 very likely [1.2, 2.4] K", "inside", f"{q_tcr[2]:.2f} K",
                   1.2 <= q_tcr[2] <= 2.4))
    checks.append(("(reported) ECS median inside AR6 likely [2.5, 4.0] K", "inside", f"{q_ecs[2]:.2f} K",
                   None))
    cm_ecs = cmip6["q4x"] / 2 / -cmip6["lamg"]
    print(f"[{time.time() - t_start:4.0f} s]    figures")
    fig_ecs_tcr(ecs, tc, ecs_w, tc_w, ecs_p, tcr_p, cm_ecs)
    fig_mcmc(samp, BURN, tau)
    fig_corner(post, ecs, tc, prior_s, ecs_p, tcr_p)
    fig_ppc(ppc, gis, last)

    print(f"[{time.time() - t_start:4.0f} s] == 8. global sensitivity: Sobol vs one-at-a-time")
    sob = sensitivity(runs["ssp245"], years)
    for out_name, Si in sob["Si"].items():
        print(f"  {out_name}: S1 " + " ".join(f"{n}={v:.3f}" for n, v in zip(NAMES[:5], Si["S1"]))
              + f"; ST " + " ".join(f"{n}={v:.3f}" for n, v in zip(NAMES[:5], Si["ST"]))
              + f"; sum S1 = {Si['S1'].sum():.3f}")
    for nom, sw in sob["oat"].items():
        print(f"  OAT swing of 2081-2100 warming at nominal {nom}: "
              + " ".join(f"{n}={v:.2f}" for n, v in zip(NAMES[:5], sw)) + " K")
    fig_sensitivity(sob)

    print(f"[{time.time() - t_start:4.0f} s] == 9. projections")
    proj = projections(post, runs, obs, idx, rng)
    for s, (name, _) in SCENARIOS.items():
        q = proj["q2100"][s]
        a = AR6_2081_2100[s]
        print(f"  {name} 2081-2100 vs 1850-1900: {q[1]:.2f} [{q[0]:.2f}, {q[2]:.2f}] K   AR6 {a[1]} [{a[0]}, {a[2]}]")
    m = (gis.index >= 2011) & (gis.index <= 2020)
    print(f"  GISTEMP on the model baseline, 2011-2020 mean: {proj['obs_rel'][m].mean():.2f} K (AR6 1.09 [0.95, 1.20]); "
          f"{last}: {proj['obs_rel'][-1]:.2f} K; forced response {last}: {proj['q']['ssp245'][2][proj['years'] == last][0]:.2f} K")
    fig_projections(proj, gis, last)
    make_hero(proj, gis, last)
    print(f"[{time.time() - t_start:4.0f} s]    writing mcmc_walkers.mp4")
    mp4_walkers(samp, post, obs, idx, gis, fna, fa)

    print("\n== verification & validation")
    ok = True
    for name, exp, got, p in checks:
        flag = "REPORT" if p is None else ("PASS" if p else "FAIL")
        ok &= p is not False
        print(f"  [{flag:6s}] {name}: expected {exp}, got {got}")
    print(f"\ntotal runtime {time.time() - t_start:.0f} s")
    assert ok, "some verification checks failed"


# =============================================================================================
# 6. Analyses
# =============================================================================================
def posterior_predictive(post, obs, idx, fna, fa, gis, years, rng, n=3000):
    th = post[rng.choice(len(post), n)]
    T = model(th, fna, fa)
    base = T[:, (years >= 1850) & (years <= 1900)].mean(1)
    mod = T[:, idx] + th[:, 5:6]
    rep = mod + ar1_noise(th[:, 6], th[:, 7], len(idx), rng)  # replicated data sets
    band = np.percentile(rep, [5, 50, 95], axis=0)
    inside = np.mean((obs >= band[0]) & (obs <= band[2]))
    yrs = gis.index.to_numpy()

    def trend(y, a=1975):
        m = yrs >= a
        return np.polyfit(yrs[m], np.atleast_2d(y)[:, m].T, 1)[0] * 10  # K/decade

    def acf1(y):  # lag-1 autocorrelation of the linearly detrended series
        y = np.atleast_2d(y)
        r = y - np.polynomial.polynomial.polyval(yrs, np.polynomial.polynomial.polyfit(yrs, y.T, 3))
        r = r - r.mean(1, keepdims=True)
        return (r[:, 1:] * r[:, :-1]).sum(1) / (r**2).sum(1)

    t_rep, t_obs = trend(rep), trend(obs)[0]
    a_rep, a_obs = acf1(rep), acf1(obs)[0]
    # residual diagnostics at the posterior median
    med = np.median(post, axis=0)
    r = obs - (model(med, fna, fa)[0, idx] + med[5])
    wht = r[1:] - med[7] * r[:-1]

    def acf(x, k=20):
        x = x - x.mean()
        return np.array([1.0] + [(x[j:] * x[:-j]).sum() / (x**2).sum() for j in range(1, k + 1)])

    # Earth's energy imbalance N = F - lam T (not used in the fit: an out-of-sample check)
    F = fna[None, :] + th[:, 4:5] * fa[None, :]
    N = F - th[:, 0:1] * T
    eei = {(a, b): N[:, (years >= a) & (years <= b)].mean(1) for a, b in AR6_EEI}
    w1120 = T[:, (years >= 2011) & (years <= 2020)].mean(1) - base
    return dict(band=band, mod=np.percentile(mod, [5, 50, 95], axis=0), inside=inside, t_rep=t_rep,
                t_obs=t_obs, p_trend=np.mean(t_rep >= t_obs), a_rep=a_rep, a_obs=a_obs,
                p_acf=np.mean(a_rep >= a_obs), acf_raw=acf(r), acf_white=acf(wht), n=len(r),
                eei=eei, w2011_2020=w1120, resid=r)


def synthetic_recovery(idx, fna, fa, pri, rng):
    """Make data from TRUTH (same years, same forcing, AR(1) noise) and check MCMC gets it back."""
    y = model(TRUTH, fna, fa)[0, idx] + TRUTH[5] + ar1_noise(TRUTH[6:7], TRUTH[7:8], len(idx), rng)[0]
    samp = run_mcmc(y, idx, fna, fa, pri, 15000, nwalkers=48, seed=SEED + 1)
    post, _ = posterior(samp, 7000)
    prior = sample_prior(20000, pri, rng)
    cols = lambda p: [F2X / p[:, 0], tcr(p)] + list(p.T)
    pc, pr = cols(post), cols(prior)
    truth = [F2X / TRUTH[0], tcr(TRUTH)[0]] + list(TRUTH)
    return dict(names=["ECS", "TCR"] + NAMES, truth=truth, post=pc, prior=pr, y=y,
                q=[ci(x) for x in pc], q99=[ci(x, (0.5, 99.5)) for x in pc],
                contraction=[x.std() / p.std() for x, p in zip(pc, pr)])


def coverage_test(idx, fna, fa, pri, K=40):
    """Calibration check: truths drawn from the prior; does the 90% CI contain the truth ~90%?"""
    rng = np.random.default_rng(SEED + 7)
    truths = sample_prior(K, pri, rng)
    hits = {"ECS": 0, "TCR": 0, "alpha": 0, "sigma": 0}
    for k, th in enumerate(truths):
        y = model(th, fna, fa)[0, idx] + th[5] + ar1_noise(th[6:7], th[7:8], len(idx), rng)[0]
        post, _ = posterior(run_mcmc(y, idx, fna, fa, pri, 5000, nwalkers=32, seed=SEED + 100 + k), 2000)
        for n, est, tv in [("ECS", F2X / post[:, 0], F2X / th[0]), ("TCR", tcr(post), tcr(th)[0]),
                           ("alpha", post[:, 4], th[4]), ("sigma", post[:, 6], th[6])]:
            lo, hi = ci(est, (5, 95))
            hits[n] += int(lo <= tv <= hi)
    return dict(K=K, hits=hits)


def warming(theta, fna, fa, years, a, b):
    T = model(theta, fna, fa)
    return T[:, (years >= a) & (years <= b)].mean(1) - T[:, (years >= 1850) & (years <= 1900)].mean(1)


SOBOL_BOUNDS = [[0.6, 2.4], [0.3, 1.2], [5.0, 12.0], [40.0, 200.0], [0.3, 1.7]]


def sensitivity(F245, years_hist):
    """Sobol (Saltelli sampling, SALib) vs one-at-a-time for two outputs of the SSP2-4.5 run."""
    fna, fa = split(F245)
    yrs = F245.index.to_numpy()
    prob = {"num_vars": 5, "names": NAMES[:5], "bounds": SOBOL_BOUNDS}
    X = sobol_sample.sample(prob, 4096, calc_second_order=False, seed=SEED)
    outs = {"2015-2024 warming": warming(X, fna, fa, yrs, 2015, 2024),
            "2081-2100 warming (SSP2-4.5)": warming(X, fna, fa, yrs, 2081, 2100)}
    Si = {k: sobol_analyze.analyze(prob, Y, calc_second_order=False, seed=SEED) for k, Y in outs.items()}
    # one-at-a-time: sweep one parameter over its whole range, the others frozen at a nominal point
    lo, hi = np.array(SOBOL_BOUNDS).T
    oat = {}
    for nom_name, nominal in [("centre (ECS 2.6 K)", (lo + hi) / 2),
                              ("high-ECS corner (lam 0.8)", np.r_[0.8, (lo + hi)[1:] / 2])]:
        sw = []
        for i in range(5):
            th = np.tile(nominal, (21, 1))
            th[:, i] = np.linspace(lo[i], hi[i], 21)
            y = warming(th, fna, fa, yrs, 2081, 2100)
            sw.append(y.max() - y.min())
        oat[nom_name] = np.array(sw)
    return dict(Si=Si, oat=oat, X=X, Y=outs)


def projections(post, runs, obs, idx, rng, n=3000):
    th = post[rng.choice(len(post), n)]
    res = dict(q={}, q2100={}, one={})
    for s, F in runs.items():
        fna, fa = split(F)
        yrs = F.index.to_numpy()
        T = model(th, fna, fa)
        base = T[:, (yrs >= 1850) & (yrs <= 1900)].mean(1, keepdims=True)
        T -= base
        m = yrs >= 1850
        res["years"] = yrs[m]
        res["q"][s] = np.percentile(T[:, m], [5, 17, 50, 83, 95], axis=0)
        res["q2100"][s] = ci(T[:, (yrs >= 2081) & (yrs <= 2100)].mean(1))
        if s == "ssp245":  # observations on the model's 1850-1900 baseline (per-sample offset T0 + base)
            res["obs_rel"] = np.median(obs[None, :] - th[:, 5:6] - base, axis=0)
            j = np.argmin(np.abs(np.median(T[:, -1]) - T[:, -1]))  # a median-ish world, plus weather
            res["one"] = T[j, m] + ar1_noise(th[j:j + 1, 6], th[j:j + 1, 7], m.sum(), rng)[0]
    return res


# =============================================================================================
# 7. Figures
# =============================================================================================
C_OBS, C_MOD, C_AR6, C_PRI = "#f2f2f2", "#ffb000", "#58c4dd", "#9a9a9a"


def savefig(fig, name):
    fig.savefig(OUT / name, dpi=130, bbox_inches="tight")
    plt.close(fig)


def fig_data(hist, co2, fit, gis, last):
    fig, ax = plt.subplots(1, 3, figsize=(17, 5), gridspec_kw={"width_ratios": [1.25, 1, 1.25]})
    y = hist.index
    for col, lab, c in [("co2", "CO$_2$", "#e8e8e8"), ("other", "other GHG, O$_3$, land use...", "#b98a0d"),
                        ("aer", "aerosols", "#58c4dd"), ("nat", "volcanic + solar", "#9a9a9a")]:
        ax[0].plot(y, hist[col], color=c, lw=1.4, label=lab)
    ax[0].plot(y, hist.sum(axis=1), color="#e02a35", lw=2.2, label="total")
    ax[0].axvspan(2019.5, last + 0.5, color="#ffffff", alpha=0.12, lw=0)
    ax[0].text(2017, -2.6, f"2020-{last}: measured CO$_2$\n+ SSP2-4.5 others", ha="right", fontsize=8.5,
               color="#bbb")
    ax[0].set(xlim=(1750, last + 2), ylim=(-3.0, 3.6), xlabel="year", ylabel="effective radiative forcing [W m$^{-2}$]",
              title="(a) IPCC AR6 effective radiative forcing (volcanic spikes clipped)")
    ax[0].legend(loc="upper left", fontsize=9)

    sc = ax[1].scatter(fit["x"], fit["y"], c=fit["years"], cmap="viridis", s=22, zorder=3)
    xx = np.linspace(0, fit["x"].max() * 1.05, 50)
    ax[1].plot(xx, fit["k"] * xx, color=C_MOD, lw=1.5,
               label=f"$F = k\\,\\ln(C/278.3)$, k = {fit['k']:.2f}\nR$^2$ = {fit['r2']:.4f}, "
                     f"$k\\ln 2$ = {fit['k'] * np.log(2):.2f} W m$^{{-2}}$")
    ax[1].plot(xx, 5.35 * xx, color=C_PRI, lw=1.2, ls="--", label="Myhre et al. 1998: k = 5.35")
    ax[1].set(xlabel="ln(CO$_2$ / 278.3 ppm), CO$_2$ from Mauna Loa", ylabel="AR6 CO$_2$ ERF [W m$^{-2}$]",
              title="(b) NOAA Mauna Loa CO$_2$ vs AR6 CO$_2$ forcing")
    ax[1].legend(loc="upper left", fontsize=9)
    cb = fig.colorbar(sc, ax=ax[1], pad=0.01)
    cb.set_label("year")

    v = gis.to_numpy()
    cmap = plt.get_cmap("RdBu_r")
    ax[2].bar(gis.index, v, color=cmap(np.clip((v + 0.6) / 2.0, 0, 1)), width=1.0, lw=0)
    ax[2].set(xlabel="year", ylabel="anomaly vs 1951-1980 [K]", xlim=(1878, last + 2),
              title=f"(c) NASA GISTEMP v4 global mean, 1880-{last}")
    fig.tight_layout()
    savefig(fig, "data_and_forcing.png")


def fig_mcmc(samp, burn, tau):
    chain = samp.get_chain()
    nstep = chain.shape[0]
    fig, axs = plt.subplots(3, 3, figsize=(16, 9.5))
    for i, ax in enumerate(axs.flat[:8]):
        ax.plot(chain[:, :, i], color=C_AR6, alpha=0.08, lw=0.5)
        ax.plot(np.median(chain[:, :, i], axis=1), color=C_MOD, lw=1.0)
        ax.axvspan(0, burn, color="#ffffff", alpha=0.07, lw=0)
        ax.set(ylabel=LABELS[i], xlim=(0, nstep))
        ax.set_xticks(np.linspace(0, nstep, 5), [f"{v / 1000:.0f}k" for v in np.linspace(0, nstep, 5)])
        ax.set_title(f"{NAMES[i]}:  $\\tau$ = {tau[i]:.0f} steps", fontsize=10)
        if i == 0:
            ax.set_yscale("log")
            ax.set_yticks([0.2, 0.5, 1, 2, 4], ["0.2", "0.5", "1", "2", "4"])
            ax.minorticks_off()
            ax.text(burn / 2, 3.6, "burn-in", ha="center", va="top", fontsize=9, color="#bbb")
    for ax in axs[2, :2]:
        ax.set_xlabel("step")
    # autocorrelation time estimate vs chain length (the emcee tutorial's convergence plot)
    ax = axs.flat[8]
    Ns = np.unique(np.geomspace(200, nstep - burn, 14).astype(int))
    post = chain[burn:]
    est = np.array([emcee.autocorr.integrated_time(post[:n], tol=0) for n in Ns])
    for i in range(8):
        ax.loglog(Ns, est[:, i], lw=1.2, alpha=0.9, label=NAMES[i])
    ax.loglog(Ns, Ns / 50, "w--", lw=1.2, label=r"$N/50$")
    ax.set(xlabel="steps after burn-in N", ylabel=r"$\hat\tau$ [steps]",
           title=f"autocorrelation time; acceptance {samp.acceptance_fraction.mean():.2f}")
    ax.legend(fontsize=7.5, ncol=3, loc="upper left")
    fig.suptitle(f"emcee: {chain.shape[1]} walkers x {nstep} steps, walkers started from prior draws "
                 "(orange = median walker)", y=1.0)
    fig.tight_layout()
    savefig(fig, "mcmc_diagnostics.png")


def credible_contours(ax, x, y, rx, ry, color):
    H, xe, ye = np.histogram2d(x, y, bins=45, range=[rx, ry])
    H = gaussian_filter(H, 1.0)
    h = np.sort(H.ravel())[::-1]
    c = np.cumsum(h) / h.sum()
    levels = sorted({h[np.searchsorted(c, q)] for q in (0.95, 0.68)}) + [H.max() * 1.01]
    xc, yc = 0.5 * (xe[1:] + xe[:-1]), 0.5 * (ye[1:] + ye[:-1])
    ax.contourf(xc, yc, H.T, levels=levels, colors=[color], alpha=0.35)
    ax.contourf(xc, yc, H.T, levels=levels[1:], colors=[color], alpha=0.55)
    ax.contour(xc, yc, H.T, levels=levels[:-1], colors=[color], linewidths=0.8)


def fig_corner(post, ecs, tc, prior, ecs_p, tcr_p):
    cols = [ecs, tc, post[:, 4], post[:, 1], post[:, 2], post[:, 3]]
    pcols = [ecs_p, tcr_p, prior[:, 4], prior[:, 1], prior[:, 2], prior[:, 3]]
    labs = ["ECS [K]", "TCR [K]", LABELS[4], LABELS[1], LABELS[2], LABELS[3]]
    rngs = [np.percentile(c, [0.5, 99.5]) for c in cols]
    n = len(cols)
    fig, axs = plt.subplots(n, n, figsize=(13, 13))
    for i in range(n):
        for j in range(n):
            ax = axs[i, j]
            if j > i:
                ax.axis("off")
                continue
            if i == j:
                bins = np.linspace(*rngs[i], 50)
                ax.hist(cols[i], bins=bins, density=True, color=C_MOD, alpha=0.8)
                ax.hist(pcols[i], bins=bins, density=True, histtype="step", color=C_PRI, lw=1.2, ls="--")
                q = ci(cols[i])
                ax.set_title(f"{labs[i].split(' [')[0]} = {q[1]:.2f}$^{{+{q[2] - q[1]:.2f}}}_{{-{q[1] - q[0]:.2f}}}$",
                             fontsize=10)
                ax.set_yticks([])
            else:
                credible_contours(ax, cols[j], cols[i], rngs[j], rngs[i], C_MOD)
                r = np.corrcoef(cols[j], cols[i])[0, 1]
                ax.text(0.95, 0.92, f"r = {r:+.2f}", transform=ax.transAxes, ha="right", va="top", fontsize=8.5)
                ax.set_ylim(*rngs[i])
            ax.set_xlim(*rngs[j])
            ax.grid(False)
            if i == n - 1:
                ax.set_xlabel(labs[j])
            else:
                ax.set_xticklabels([])
            if j == 0 and i > 0:
                ax.set_ylabel(labs[i])
            elif j > 0:
                ax.set_yticklabels([])
    r = lambda a, b: np.corrcoef(cols[a], cols[b])[0, 1]
    fig.text(0.6, 0.8, "Posterior (68% and 95% regions)\nOrange: posterior  |  grey dashed: prior\n"
             "Titles: median and 5-95% range\n\n"
             f"Ridge 1 (TCR-aerosol, r = {r(1, 2):+.2f}): stronger aerosol\n"
             "cooling (bigger alpha) must be offset by a\nlarger transient response to fit the record.\n\n"
             f"Ridge 2 (ECS-gamma, r = {r(0, 3):+.2f}): a sensitive climate\n"
             "hides its warming if the deep ocean\nabsorbs heat faster. Same surface record,\ndifferent futures.",
             fontsize=11, va="top")
    fig.tight_layout()
    savefig(fig, "corner.png")


def fig_ppc(ppc, gis, last):
    yrs = gis.index.to_numpy()
    fig, axs = plt.subplots(2, 2, figsize=(15, 9.5))
    ax = axs[0, 0]
    b = ppc["band"]
    ax.fill_between(yrs, b[0], b[2], color=C_AR6, alpha=0.25, lw=0, label="90% posterior predictive (with AR(1) noise)")
    ax.fill_between(yrs, ppc["mod"][0], ppc["mod"][2], color=C_MOD, alpha=0.45, lw=0, label="90% forced response")
    ax.plot(yrs, ppc["mod"][1], color=C_MOD, lw=1.5)
    obs = gis.to_numpy()
    out = (obs < b[0]) | (obs > b[2])
    ax.plot(yrs, obs, "o", color=C_OBS, ms=3.2, label="GISTEMP")
    ax.plot(yrs[out], obs[out], "o", mfc="none", mec="#e02a35", ms=8, mew=1.4, label="outside the 90% band")
    ax.set(xlabel="year", ylabel="anomaly vs 1951-1980 [K]", xlim=(1878, last + 2),
           title=f"(a) posterior predictive check: {ppc['inside'] * 100:.1f}% of years inside the 90% band")
    ax.legend(loc="upper left", fontsize=9)

    ax = axs[0, 1]
    k = np.arange(len(ppc["acf_raw"]))
    ax.bar(k - 0.18, ppc["acf_raw"], width=0.36, color=C_PRI, label="raw residuals $r_t$")
    ax.bar(k + 0.18, ppc["acf_white"], width=0.36, color=C_MOD, label=r"whitened $e_t = r_t - \rho\, r_{t-1}$")
    ax.axhspan(-1.96 / np.sqrt(ppc["n"]), 1.96 / np.sqrt(ppc["n"]), color="#ffffff", alpha=0.12, lw=0,
               label="white-noise 95% band")
    ax.set_xticks(range(1, len(k), 2))
    ax.set(xlabel="lag [yr]", ylabel="autocorrelation", xlim=(0.4, len(k) - 0.4),
           title="(b) residual autocorrelation at the posterior median")
    ax.legend(fontsize=9)

    ax = axs[1, 0]
    for x, xo, p, lab, c, a in [(ppc["t_rep"], ppc["t_obs"], ppc["p_trend"], f"trend 1975-{last} [K/decade]", C_AR6, 0),
                                (ppc["a_rep"], ppc["a_obs"], ppc["p_acf"], "lag-1 autocorrelation (detrended)", C_MOD, 1)]:
        ins = ax.inset_axes([0.0 + 0.53 * a, 0.0, 0.47, 1.0])
        ins.hist(x, bins=50, color=c, alpha=0.8)
        ins.axvline(xo, color=C_OBS, lw=2)
        ins.set(xlabel=lab, yticks=[])
        ins.set_title(f"observed vs replicated: p = {p:.2f}", fontsize=10)
    ax.axis("off")
    ax.set_title("(c) test statistics: GISTEMP (white line) vs 3000 replicated records", pad=24)

    ax = axs[1, 1]
    for k_, ((a, b_), (lo, md, hi)) in enumerate(AR6_EEI.items()):
        x = ppc["eei"][(a, b_)]
        h = np.histogram(x, bins=60, range=(0, 1.6), density=True)
        ax.stairs(h[0] / h[0].max() * 0.8 + k_, h[1], baseline=k_, fill=True, color=[C_MOD, C_AR6][k_], alpha=0.6)
        ax.errorbar(md, k_ + 0.9, xerr=[[md - lo], [hi - md]], fmt="D", color=C_OBS, capsize=4, ms=6)
        ax.text(1.58, k_ + 0.4, f"{a}-{b_}\nmodel {np.median(x):.2f} W m$^{{-2}}$\nAR6 {md} [{lo}, {hi}]",
                ha="right", va="center", fontsize=9.5)
    ax.set(xlim=(0, 1.6), yticks=[], xlabel="Earth energy imbalance N = F - $\\lambda$T [W m$^{-2}$]",
           title="(d) out-of-sample check: planetary heat uptake (not used in the fit)")
    fig.tight_layout()
    savefig(fig, "posterior_predictive.png")


def fig_synthetic(syn, cov):
    fig = plt.figure(figsize=(17, 9.5))
    gs = fig.add_gridspec(3, 5, height_ratios=[1, 1, 0.8])
    labs = ["ECS [K]", "TCR [K]"] + LABELS
    for k in range(10):
        ax = fig.add_subplot(gs[k // 5, k % 5])
        x, p, tv = syn["post"][k], syn["prior"][k], syn["truth"][k]
        a, b = np.percentile(x, [0.2, 99.8])
        a, b = min(a, tv) - 0.4 * (b - a), max(b, tv) + 0.4 * (b - a)
        rngx = (max(a, np.percentile(p, 0.1)), min(b, np.percentile(p, 99.9)))
        bins = np.linspace(*rngx, 50)
        ax.hist(p, bins=bins, density=True, histtype="step", color=C_PRI, ls="--", lw=1.2)
        ax.hist(x, bins=bins, density=True, color=C_AR6, alpha=0.75)
        lo, md, hi = syn["q"][k]
        ax.axvspan(lo, hi, color=C_AR6, alpha=0.12, lw=0)
        ax.axvline(tv, color=C_MOD, lw=2)
        ax.set(xlabel=labs[k], yticks=[])
        inside = "in" if lo <= tv <= hi else "OUT"
        ax.set_title(f"{syn['names'][k]}: truth {inside} 90% CI\nsd post/prior = {syn['contraction'][k]:.2f}",
                     fontsize=10)
    ax = fig.add_subplot(gs[2, :])
    names = list(cov["hits"])
    h = np.array([cov["hits"][n] for n in names]) / cov["K"]
    ax.barh(names, h, color=C_AR6, height=0.55)
    ax.axvline(0.9, color=C_MOD, lw=2, label="nominal 90%")
    lo, hi = np.percentile(np.random.default_rng(0).binomial(cov["K"], 0.9, 100000), [0.5, 99.5]) / cov["K"]
    ax.axvspan(lo, hi, color=C_MOD, alpha=0.15, lw=0, label=f"binomial 99% range for {cov['K']} worlds")
    for i, v in enumerate(h):
        ax.text(v + 0.005, i, f"{cov['hits'][names[i]]}/{cov['K']}", va="center", fontsize=10)
    ax.set(xlim=(0.5, 1.3), xlabel="fraction of synthetic worlds whose truth fell inside the 90% credible interval",
           title=f"coverage test: {cov['K']} synthetic Earths with parameters drawn from the prior")
    ax.set_xticks(np.arange(0.5, 1.01, 0.1))
    ax.legend(loc="center right", fontsize=9)
    fig.suptitle("Synthetic-truth recovery: data generated by the model from known parameters "
                 "(orange line = truth, blue = posterior, grey dashed = prior)", y=1.0)
    fig.tight_layout()
    savefig(fig, "synthetic_truth.png")


def fig_ecs_tcr(ecs, tc, ecs_w, tc_w, ecs_p, tcr_p, cm_ecs):
    fig, axs = plt.subplots(1, 2, figsize=(15, 5.6))
    for ax, x, xw, xp, ar6, name, xmax in [(axs[0], ecs, ecs_w, ecs_p, AR6_ECS, "ECS", 7.0),
                                           (axs[1], tc, tc_w, tcr_p, AR6_TCR, "TCR", 3.5)]:
        bins = np.linspace(0, xmax, 90)
        ax.hist(xp, bins=bins, density=True, histtype="step", color=C_PRI, ls="--", lw=1.3, label="prior")
        ax.hist(x, bins=bins, density=True, color=C_MOD, alpha=0.75, label="posterior, AR(1) noise")
        wr = np.diff(ci(xw, (5, 95)))[0] / np.diff(ci(x, (5, 95)))[0]
        ax.hist(xw, bins=bins, density=True, histtype="step", color="#e02a35", lw=1.6,
                label=f"posterior, white noise ($\\rho$=0)\n  90% range x{wr:.2f} of AR(1)")
        top = ax.get_ylim()[1]
        y0 = top * 1.08
        ax.plot([ar6[0], ar6[4]], [y0, y0], color=C_AR6, lw=3, solid_capstyle="butt")
        ax.plot([ar6[1], ar6[3]], [y0, y0], color=C_AR6, lw=9, solid_capstyle="butt")
        ax.plot(ar6[2], y0, "D", color="white", ms=7)
        ax.text(ar6[4] + 0.08, y0, "IPCC AR6: best, likely (66%), very likely (90%)", va="center",
                fontsize=9, color=C_AR6)
        q = ci(x)
        y1 = top * 1.2
        ax.plot([q[0], q[2]], [y1, y1], color=C_MOD, lw=3)
        ax.plot(q[1], y1, "D", color="white", ms=7)
        ax.text(q[2] + 0.08, y1, f"this posterior: {q[1]:.2f} [{q[0]:.2f}, {q[2]:.2f}] K", va="center",
                fontsize=9, color=C_MOD)
        ax.set(xlim=(0, xmax), ylim=(0, top * 1.32), xlabel=f"{name} [K]", yticks=[],
               title={"ECS": "Equilibrium climate sensitivity (ECS = F$_{2x}$/$\\lambda$)",
                      "TCR": "Transient climate response (1%/yr CO$_2$, years 61-80)"}[name])
        ax.legend(loc="center right", fontsize=9, bbox_to_anchor=(1.0, 0.42))
    axs[0].plot(cm_ecs, np.full(len(cm_ecs), axs[0].get_ylim()[1] * 0.02), "|", color="white", ms=14, mew=1.2)
    axs[0].text(cm_ecs.max(), axs[0].get_ylim()[1] * 0.07, f"{len(cm_ecs)} CMIP6 models", ha="right",
                fontsize=9, color="#ccc")
    fig.tight_layout()
    savefig(fig, "ecs_tcr_vs_ar6.png")


def fig_sensitivity(sob):
    fig, axs = plt.subplots(1, 3, figsize=(18, 5.6), gridspec_kw={"width_ratios": [1.2, 1, 1]})
    ax = axs[0]
    x = np.arange(5)
    for k, (name, Si) in enumerate(sob["Si"].items()):
        c = [C_AR6, C_MOD][k]
        ax.bar(x + (k - 0.5) * 0.4, Si["ST"], width=0.38, color=c, alpha=0.35, edgecolor=c,
               label=f"{name}: total S$_T$")
        ax.bar(x + (k - 0.5) * 0.4, Si["S1"], width=0.24, color=c, yerr=Si["S1_conf"], capsize=3,
               ecolor="#ddd", label=f"{name}: first-order S$_1$  (sum {Si['S1'].sum():.2f})")
    ax.set_xticks(x, [LABELS[i].split(" [")[0] for i in range(5)])
    ax.set(ylabel="Sobol index", title="(a) Sobol indices over the parameter box (SALib, 28 672 runs)")
    ax.legend(fontsize=8.5, loc="upper right")
    ax = axs[1]
    for k, (nom, sw) in enumerate(sob["oat"].items()):
        ax.barh(x + (k - 0.5) * 0.38, sw, height=0.36, color=[C_PRI, "#e02a35"][k], label=f"nominal: {nom}")
    ax.set_yticks(x, [LABELS[i].split(" [")[0] for i in range(5)])
    ax.invert_yaxis()
    ax.set(xlabel="swing of 2081-2100 warming when only this parameter moves [K]",
           title="(b) one-at-a-time: the answer depends on where you stand")
    ax.legend(fontsize=9, loc="lower right")
    ax = axs[2]
    X, Y = sob["X"], sob["Y"]["2081-2100 warming (SSP2-4.5)"]
    sc = ax.scatter(F2X / X[:, 0], Y, c=X[:, 4], s=3, cmap="viridis", alpha=0.6, rasterized=True)
    cb = fig.colorbar(sc, ax=ax, pad=0.01)
    cb.set_label(r"aerosol scale $\alpha_{aer}$")
    ax.set(xlabel="ECS = F$_{2x}$/$\\lambda$ [K]", ylabel="2081-2100 warming, SSP2-4.5 [K]",
           title="(c) the runs behind (a): ECS sets the level, the rest the spread")
    fig.tight_layout()
    savefig(fig, "sobol_vs_oat.png")


def spread(y, gap):
    """Nudge label heights apart so no two are closer than `gap`, keeping their order."""
    order = np.argsort(y)
    ys = np.asarray(y, float)[order]
    for i in range(1, len(ys)):
        ys[i] = max(ys[i], ys[i - 1] + gap)
    out = np.empty_like(ys)
    out[order] = ys
    return out


def fan(ax, yrs, q, color, lw=2.0, a1=0.16, a2=0.32):
    ax.fill_between(yrs, q[0], q[4], color=color, alpha=a1, lw=0)
    ax.fill_between(yrs, q[1], q[3], color=color, alpha=a2, lw=0)
    ax.plot(yrs, q[2], color=color, lw=lw)


def fig_projections(proj, gis, last):
    fig = plt.figure(figsize=(16, 8))
    gs = fig.add_gridspec(1, 3, width_ratios=[4.2, 0.62, 1], wspace=0.02)
    ax = fig.add_subplot(gs[0])
    yrs = proj["years"]
    hist = yrs <= last
    fan(ax, yrs[hist], proj["q"]["ssp245"][:, hist], "#dddddd", lw=1.5, a1=0.12, a2=0.25)
    end = spread([proj["q"][s][2, -1] for s in SCENARIOS], 0.25)
    for (s, (name, c)), yl in zip(SCENARIOS.items(), end):
        fut = yrs >= last
        fan(ax, yrs[fut], proj["q"][s][:, fut], c)
        ax.text(2102, yl, f"{name}  {proj['q'][s][2, -1]:.1f} K", color=c, va="center",
                fontsize=10.5, fontweight="bold")
    ax.text(2102, end.max() + 0.45, "median in 2100", color="#aaa", fontsize=9.5)
    ax.plot(gis.index, proj["obs_rel"], "o", color=C_OBS, ms=3, label="NASA GISTEMP (on the model's baseline)")
    ax.plot(yrs, proj["one"], color="#b98a0d", lw=0.7, alpha=0.8,
            label="one simulated world: SSP2-4.5 forced response + AR(1) weather")
    ax.axvline(last + 0.5, color="#888", lw=0.8, ls=":")
    ax.set(xlim=(1850, 2100), ylim=(-0.6, 6.5), xlabel="year",
           ylabel="global mean surface temperature vs 1850-1900 [K]",
           title="Posterior-predictive projections of the calibrated two-layer model (bands: 5-95% and 17-83%)")
    ax.legend(loc="upper left", fontsize=9.5)
    ax.text(0.99, 0.02, "What this can NOT tell you: regional change, extremes, tipping points,\n"
            "carbon-cycle feedbacks (forcing is prescribed), the pattern effect, or\n"
            "uncertainty in any forcing except the aerosol scale. Weather is a statistical AR(1).",
            transform=ax.transAxes, ha="right", va="bottom", fontsize=9, color="#aaa")
    ax2 = fig.add_subplot(gs[2], sharey=ax)
    for k, (s, (name, c)) in enumerate(SCENARIOS.items()):
        q, a = proj["q2100"][s], AR6_2081_2100[s]
        ax2.plot([k - 0.15] * 2, [q[0], q[2]], color=c, lw=5, solid_capstyle="butt")
        ax2.plot(k - 0.15, q[1], "D", color="white", ms=6)
        ax2.plot([k + 0.15] * 2, [a[0], a[2]], color=c, lw=5, alpha=0.4, solid_capstyle="butt")
        ax2.plot(k + 0.15, a[1], "o", color="white", ms=6, mfc="none")
    ax2.set_xticks(range(5), [n for n, _ in SCENARIOS.values()], rotation=45, fontsize=9)
    ax2.tick_params(labelleft=False)
    ax2.set_title("2081-2100 (5-95%)\nsolid: this model\nfaint: IPCC AR6", fontsize=10)
    fig.savefig(OUT / "projections.png", dpi=130, bbox_inches="tight")
    plt.close(fig)


def make_hero(proj, gis, last):
    fig = plt.figure(figsize=(16, 9), facecolor="#05070b")
    ax = fig.add_axes([0.06, 0.2, 0.8, 0.64], facecolor="#05070b")
    yrs = proj["years"]
    hist = yrs <= last
    fan(ax, yrs[hist], proj["q"]["ssp245"][:, hist], "#dddddd", lw=1.4, a1=0.10, a2=0.22)
    end = spread([proj["q"][s][2, -1] for s in SCENARIOS], 0.55)
    for (s, (name, c)), yl in zip(SCENARIOS.items(), end):
        fut = yrs >= last
        q = proj["q"][s][:, fut]
        for w, a in [(9, 0.06), (5, 0.12)]:  # glow
            ax.plot(yrs[fut], q[2], color=c, lw=w, alpha=a, solid_capstyle="round")
        fan(ax, yrs[fut], q, c, lw=2.2, a1=0.14, a2=0.3)
        ax.text(2102, yl, f"{name}\n{q[2, -1]:.1f} K [{q[0, -1]:.1f}-{q[4, -1]:.1f}]", color=c,
                va="center", fontsize=12, fontweight="bold", linespacing=1.1)
    ax.text(2102, end.max() + 0.6, "2100: median [5-95%]", color="#999", fontsize=10.5)
    ax.plot(gis.index, proj["obs_rel"], "o", color="#ffffff", ms=3.4, alpha=0.95)
    ax.text(1885, 1.55, "NASA GISTEMP\nobservations", color="#ddd", fontsize=11)
    ax.set(xlim=(1850, 2100), ylim=(-0.5, 6.2))
    ax.set_ylabel("warming vs 1850-1900 [K]", color="#ccc", fontsize=12)
    ax.grid(alpha=0.08)
    for sp in ["top", "right"]:
        ax.spines[sp].set_visible(False)
    ax.tick_params(colors="#bbb", labelsize=11)
    fig.text(0.06, 0.93, "EARTH'S THERMOSTAT", fontsize=30, fontweight="bold", color="white")
    fig.text(0.06, 0.885, "A two-layer climate model, calibrated by MCMC on 146 years of NASA temperatures, "
             "projects five IPCC futures", fontsize=14, color="#bbb")
    # warming stripes: observed until `last`, then one simulated SSP2-4.5 world (median-ish + weather)
    sx = fig.add_axes([0.06, 0.08, 0.8, 0.05])
    obs_y = gis.index.to_numpy()
    fut = yrs > last
    vals = np.r_[proj["obs_rel"], proj["one"][fut]]
    cmap = LinearSegmentedColormap.from_list("stripes", ["#08306b", "#4292c6", "#f7f7f7", "#ef3b2c", "#67000d"])
    colour = cmap(np.clip(0.5 + (vals - 0.6) / 4.4, 0, 1))  # white at 0.6 K (1971-2000-ish), darkest at 2.8 K
    sx.bar(np.r_[obs_y, yrs[fut]], np.ones(len(vals)), width=1.0, color=colour, lw=0)
    sx.axvline(last + 0.5, color="black", lw=2)
    sx.set(xlim=(1850, 2100), ylim=(0, 1), yticks=[])
    sx.tick_params(colors="#bbb", labelsize=10)
    for sp in sx.spines.values():
        sp.set_visible(False)
    fig.text(0.06, 0.14, f"observed 1880-{last}", fontsize=10, color="#bbb")
    fig.text(0.86, 0.14, "one simulated SSP2-4.5 future", fontsize=10, color="#bbb", ha="right")
    fig.text(0.06, 0.02, "Bands: 5-95% and 17-83% posterior (emcee). Forcing: IPCC AR6 ERF + SSPs. Not included: "
             "carbon-cycle feedbacks, pattern effect, non-aerosol forcing uncertainty, regional detail.",
             fontsize=10, color="#888")
    fig.savefig(OUT / "hero.png", dpi=120, facecolor=fig.get_facecolor())
    plt.close(fig)


def mp4_walkers(samp, post, obs, idx, gis, fna, fa):
    """emcee in motion: walkers climb from the prior onto the posterior ridge."""
    plt.rcParams["animation.ffmpeg_path"] = imageio_ffmpeg.get_ffmpeg_exe()
    chain = samp.get_chain()
    steps = np.unique(np.r_[np.arange(40), np.geomspace(40, 3000, 110)].astype(int))
    steps = np.r_[steps, [steps[-1]] * 36]  # hold the last frame
    fig, (a1, a2) = plt.subplots(1, 2, figsize=(12.8, 6.0), gridspec_kw={"width_ratios": [1, 1.25]})
    a1.set(xscale="log", xlim=(0.9, 22), ylim=(0, 2.6), xlabel="ECS = F$_{2x}$/$\\lambda$ [K]",
           ylabel=r"aerosol scale $\alpha_{aer}$")
    lx = np.log10(F2X / post[:, 0])  # final posterior as a faint target (contours in log-ECS)
    H, xe, ye = np.histogram2d(lx, post[:, 4], bins=40, range=[[0, 1.35], [0, 2.6]])
    H = gaussian_filter(H, 1.0)
    h = np.sort(H.ravel())[::-1]
    lev = [h[np.searchsorted(np.cumsum(h) / h.sum(), q)] for q in (0.95, 0.68)]
    a1.contour(10 ** (0.5 * (xe[1:] + xe[:-1])), 0.5 * (ye[1:] + ye[:-1]), H.T, levels=lev, colors="#ffffff",
               linewidths=0.9, alpha=0.6)
    a1.text(1.25, 0.12, "white: final posterior (68/95%)", color="#ccc", fontsize=9)
    a1.set_xticks([1, 2, 3, 5, 10, 20], ["1", "2", "3", "5", "10", "20"])
    a1.axvspan(AR6_ECS[1], AR6_ECS[3], color=C_AR6, alpha=0.12, lw=0)
    a1.text(3.1, 2.5, "AR6 likely ECS", color=C_AR6, fontsize=9, ha="center", va="top")
    trails = [a1.plot([], [], "o", color=C_MOD, ms=m, alpha=a)[0] for m, a in [(2, 0.15), (3, 0.3), (5, 0.9)]]
    yrs = np.arange(len(fna)) + 1750
    a2.plot(gis.index, obs, "o", color=C_OBS, ms=3, zorder=5)
    lines = a2.plot(yrs, np.zeros((len(yrs), chain.shape[1])), color=C_MOD, lw=0.6, alpha=0.35)
    a2.set(xlim=(1850, gis.index[-1] + 1), ylim=(-1.2, 2.5), xlabel="year",
           ylabel="GISTEMP anomaly vs 1951-1980 [K]")
    title = fig.suptitle("")
    fig.tight_layout()

    def update(f):
        s = steps[f]
        for tr, lag in zip(trails, [10, 4, 0]):
            th = chain[max(s - lag, 0)]
            tr.set_data(F2X / th[:, 0], th[:, 4])
        th = chain[s]
        T = model(th, fna, fa) + th[:, 5:6]
        for ln, y in zip(lines, T):
            ln.set_ydata(y)
        title.set_text(f"emcee walkers exploring the posterior: step {s + 1}  "
                       f"(left: parameter space, right: each walker's simulated climate vs NASA data)")
        return trails + lines

    ani = animation.FuncAnimation(fig, update, frames=len(steps), blit=False)
    ani.save(OUT / "mcmc_walkers.mp4", writer=animation.FFMpegWriter(fps=24, bitrate=2400,
                                                                     extra_args=["-pix_fmt", "yuv420p"]), dpi=100)
    plt.close(fig)


if __name__ == "__main__":
    main()